Macro Terminal
See the whole world, then zoom into one country.
Start on a world map of one indicator, move the year, then open the country that stands out. Every figure carries its provider and its year.
GDP per capita · world
World Bank · current US$ · 2024 · example dataWorld aggregates
World Bank · 2024 · click a tile for the chartGDP per capita · world
World Bank · current US$ · 2024 · example dataWorld aggregates
World Bank · 2024 · click a tile for the chartGDP per capita · world
World Bank · current US$ · 1990 · example dataWorld aggregates
World Bank · 1990 · click a tile for the chart6 of 34 years shown · full series in DESK
6 of 34 years shown · full series in DESK
6 of 34 years shown · full series in DESK
6 of 34 years shown · full series in DESK
6 of 34 years shown · full series in DESK
6 of 34 years shown · full series in DESK
What you get
- 900+ indicators on interactive world maps, with a time slider back through the years.
- Country pages covering government, economy, geopolitics, military and trade.
- Production, resource and trade-flow maps, plus armed-conflict data.
- Compare up to six countries in one chart.
- Rankings that say where a country stands and out of how many.
- Company pages with filings, safety and relations, and your own maps drawn on top — both part of the Macro Terminal.
One indicator, the whole world
Pick an indicator and read it as a map before you read it as a number.
One country, every topic
Overview, government, economy, geopolitics, military and trade in one page.
Provenance on every panel
Provider, unit and year sit in the panel header, not in a footnote.
Inside DESK
What it looks like.
Screens from the running app. The figures are blurred on purpose: this page shows how the terminal works — the numbers are inside DESK.
Search, and the terminal takes you there
Type any of the 900+ indicators into the table search and the view jumps to that column. The same field takes conditions such as “inflation < 2” or “debt > 100 and growth > 2”.
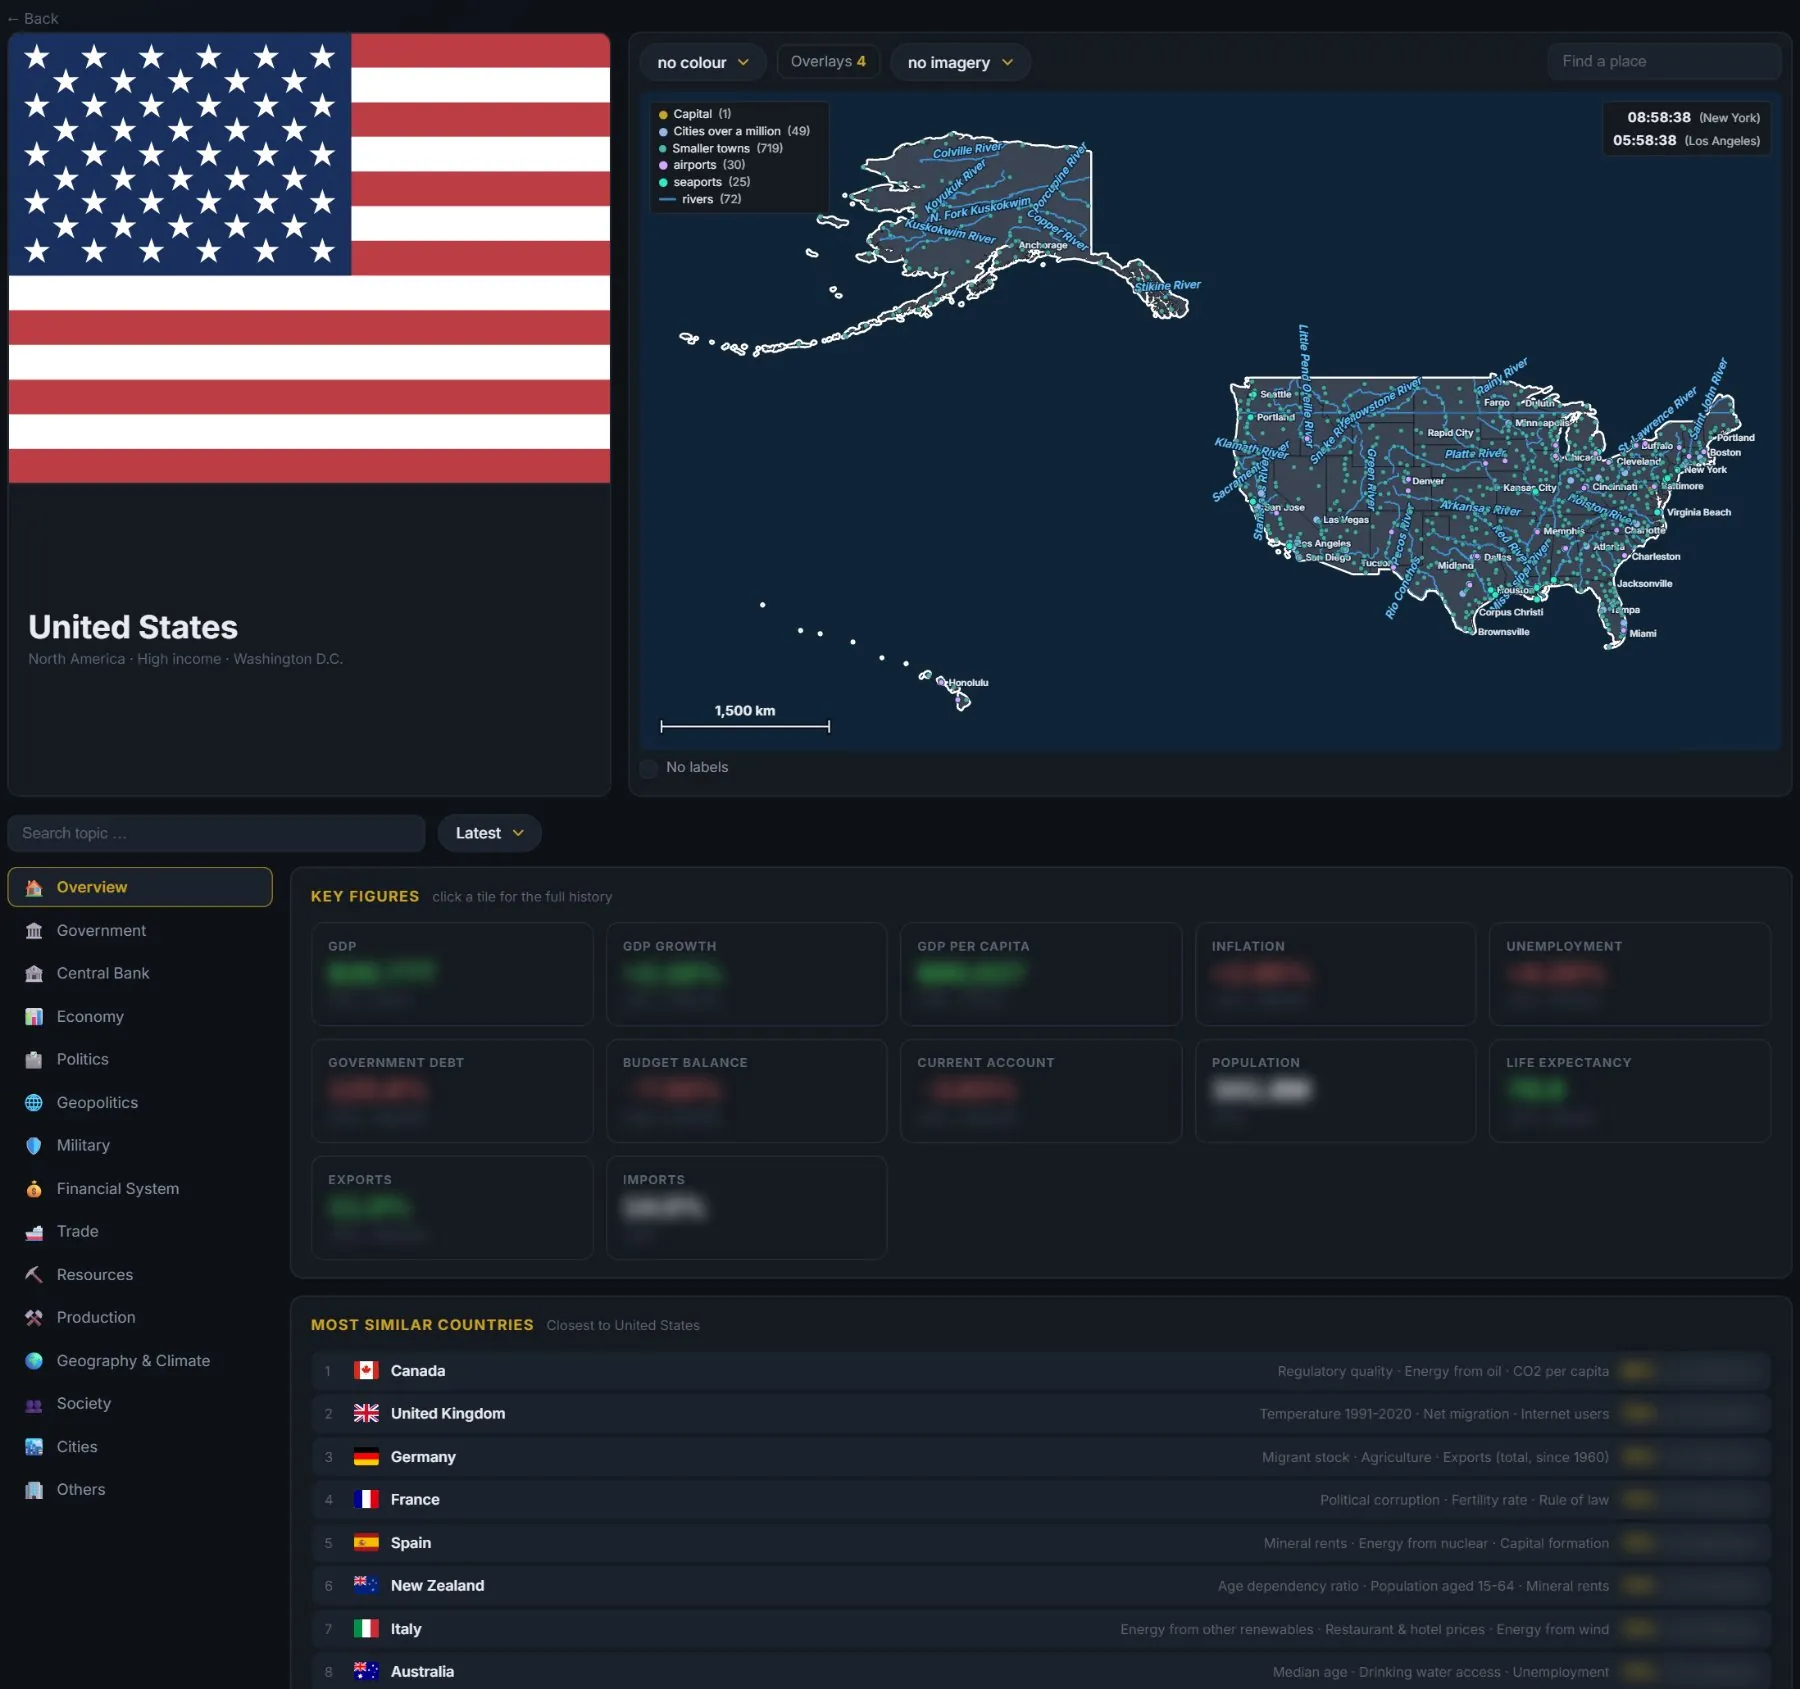
Every country on one page
Open any country from a map, a table or the search. Its page starts with the flag, a map and the figures that describe it.
- A map with the capital, large cities, towns, airports, seaports and rivers — and the local time.
- Fifteen topics, from government, central bank and economy to military, trade, production, geography & climate and cities.
- Key figures with the country’s rank among all countries; every figure opens its full history.
- The most similar countries, and the indicators that make them alike.
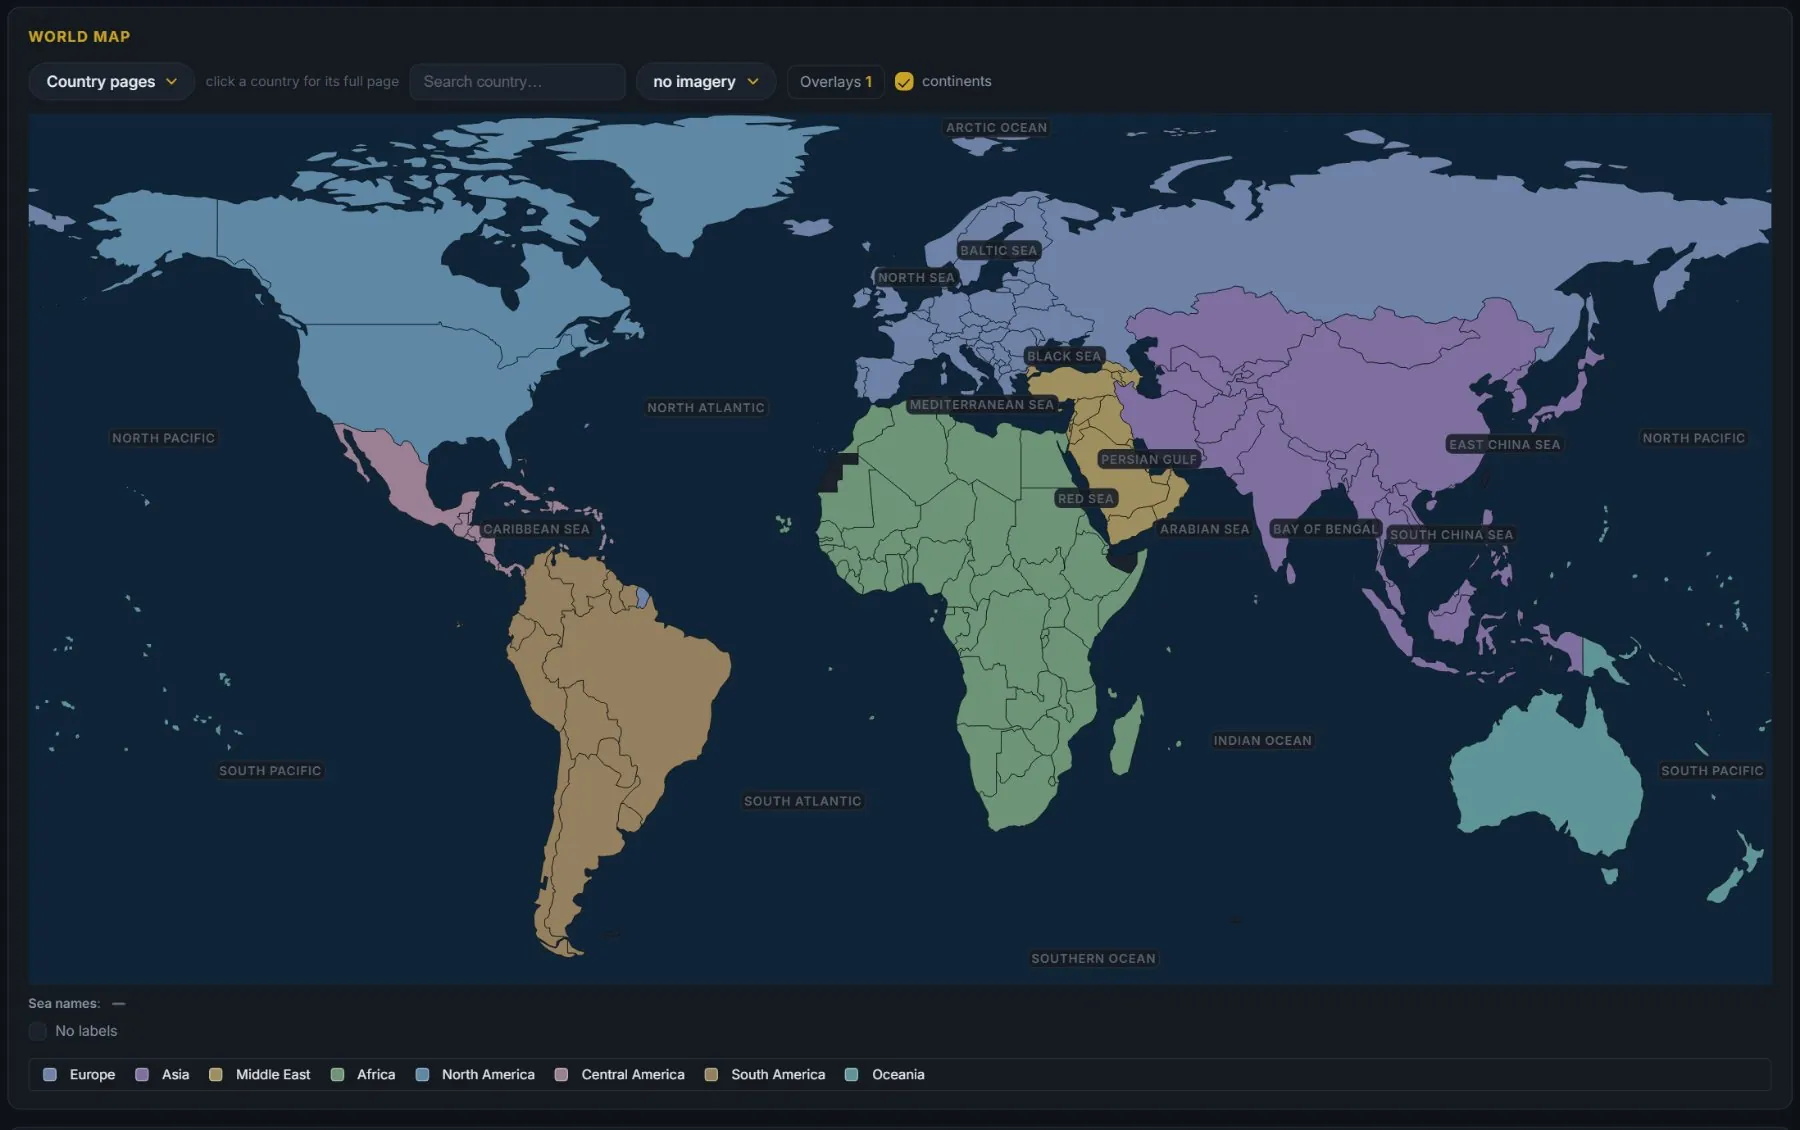
The whole world, one click from any country
The country-pages map colours the world by continent. Click a country and its page opens.
- Switch to the indicator map: any of the 900+ indicators, with a time slider back through the years.
- Backgrounds: satellite, night lights, vegetation, elevation, climate zones and time zones.
- Overlays for ports, airports, trade corridors, chokepoints and armed conflicts.
- A search field to jump straight to a country.
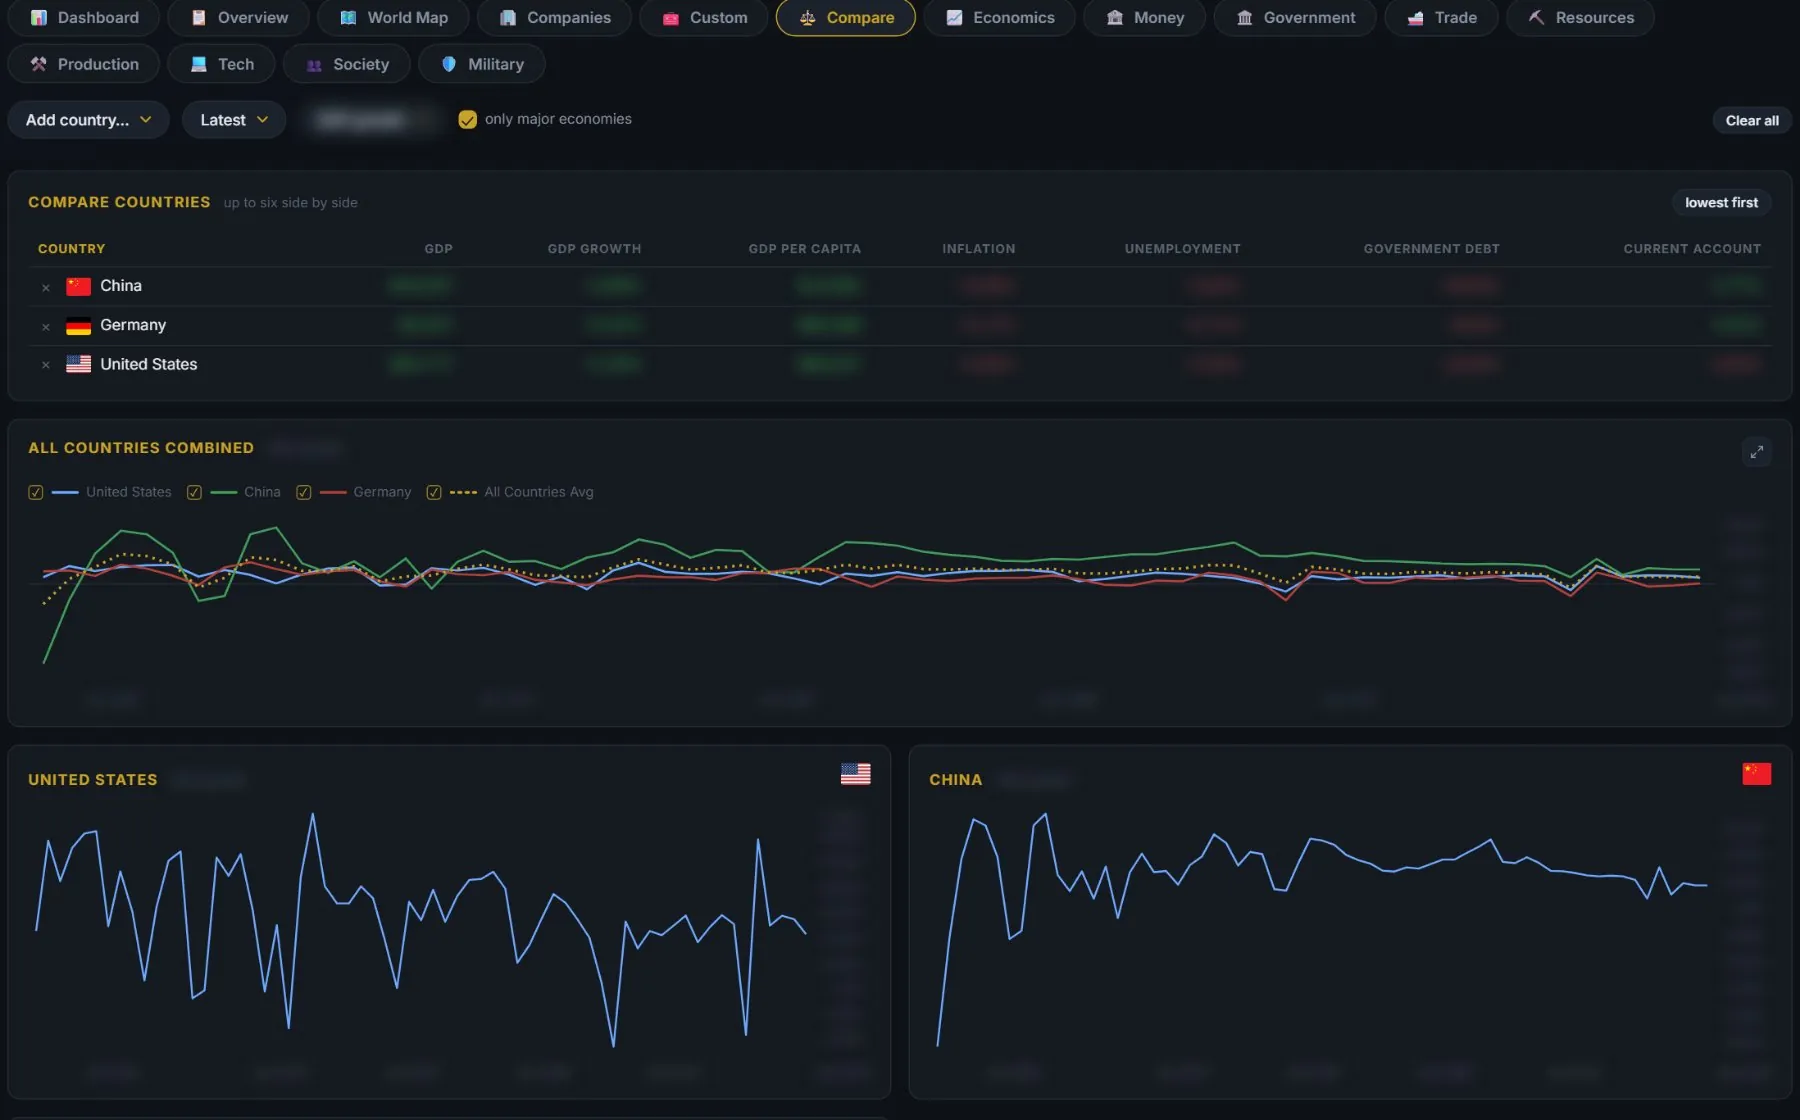
Countries side by side
Compare up to six countries on any indicator, in one table and in charts.
- The key figures of every selected country in one sortable table.
- A combined chart with the average of all countries, and one chart per country.
- Pick a year, or stay on the latest figures.
- “Only major economies” keeps the country list short.
Built on
named on every panel in the appWorld Bank · OECD · CEPII BACI · UCDP · Wikidata · Natural Earth · OpenStreetMap · NASA