Macro Terminal · Company pages
Know the company, not just the ticker.
Reported figures from official filings, how the business behaved in past crises, and who it depends on.
Company header
SEC EDGAR · Wikidata · example dataclick a tile for the reported series
Company header
SEC EDGAR · Wikidata · example dataclick a tile for the reported series
Company header
SEC EDGAR · Wikidata · example data| # | Company | Revenue | 1y | DESK score |
|---|---|---|---|---|
| 1 | Northline Retail | $648B | +2.4% | 74 |
| 2 | Vantis Energy | $413B | -6.1% | 61 |
| 3 | Corelink Motors | $286B | +1.2% | 58 |
| 4 | Halden Pharma | $204B | +5.7% | 69 |
| 5 | Ferrus Steel | $188B | — | 47 |
5 of 4,700+ companies · safety & relations in DESK
6 of 24 reported years · balance sheet in DESK
6 of 24 reported years · balance sheet in DESK
6 of 24 reported years · balance sheet in DESK
What you get
- Revenue, profit and balance sheet over time from official filings.
- A Safety view showing how the business held up in past crises.
- Relations: where its raw materials come from and who it depends on.
- DESK score and an attractiveness matrix to compare peers.
- Peer tables you can sort and rank.
Filings, not summaries
The series come from the reported statements, with the filing year named.
Crisis behaviour
What happened to revenue and margin the last time conditions turned.
Dependencies
Inputs, suppliers and regions the business needs to keep running.
Inside DESK
What it looks like.
Screens from the running app. Figures, rankings and the names in the attractive cluster are blurred on purpose — they are inside DESK.
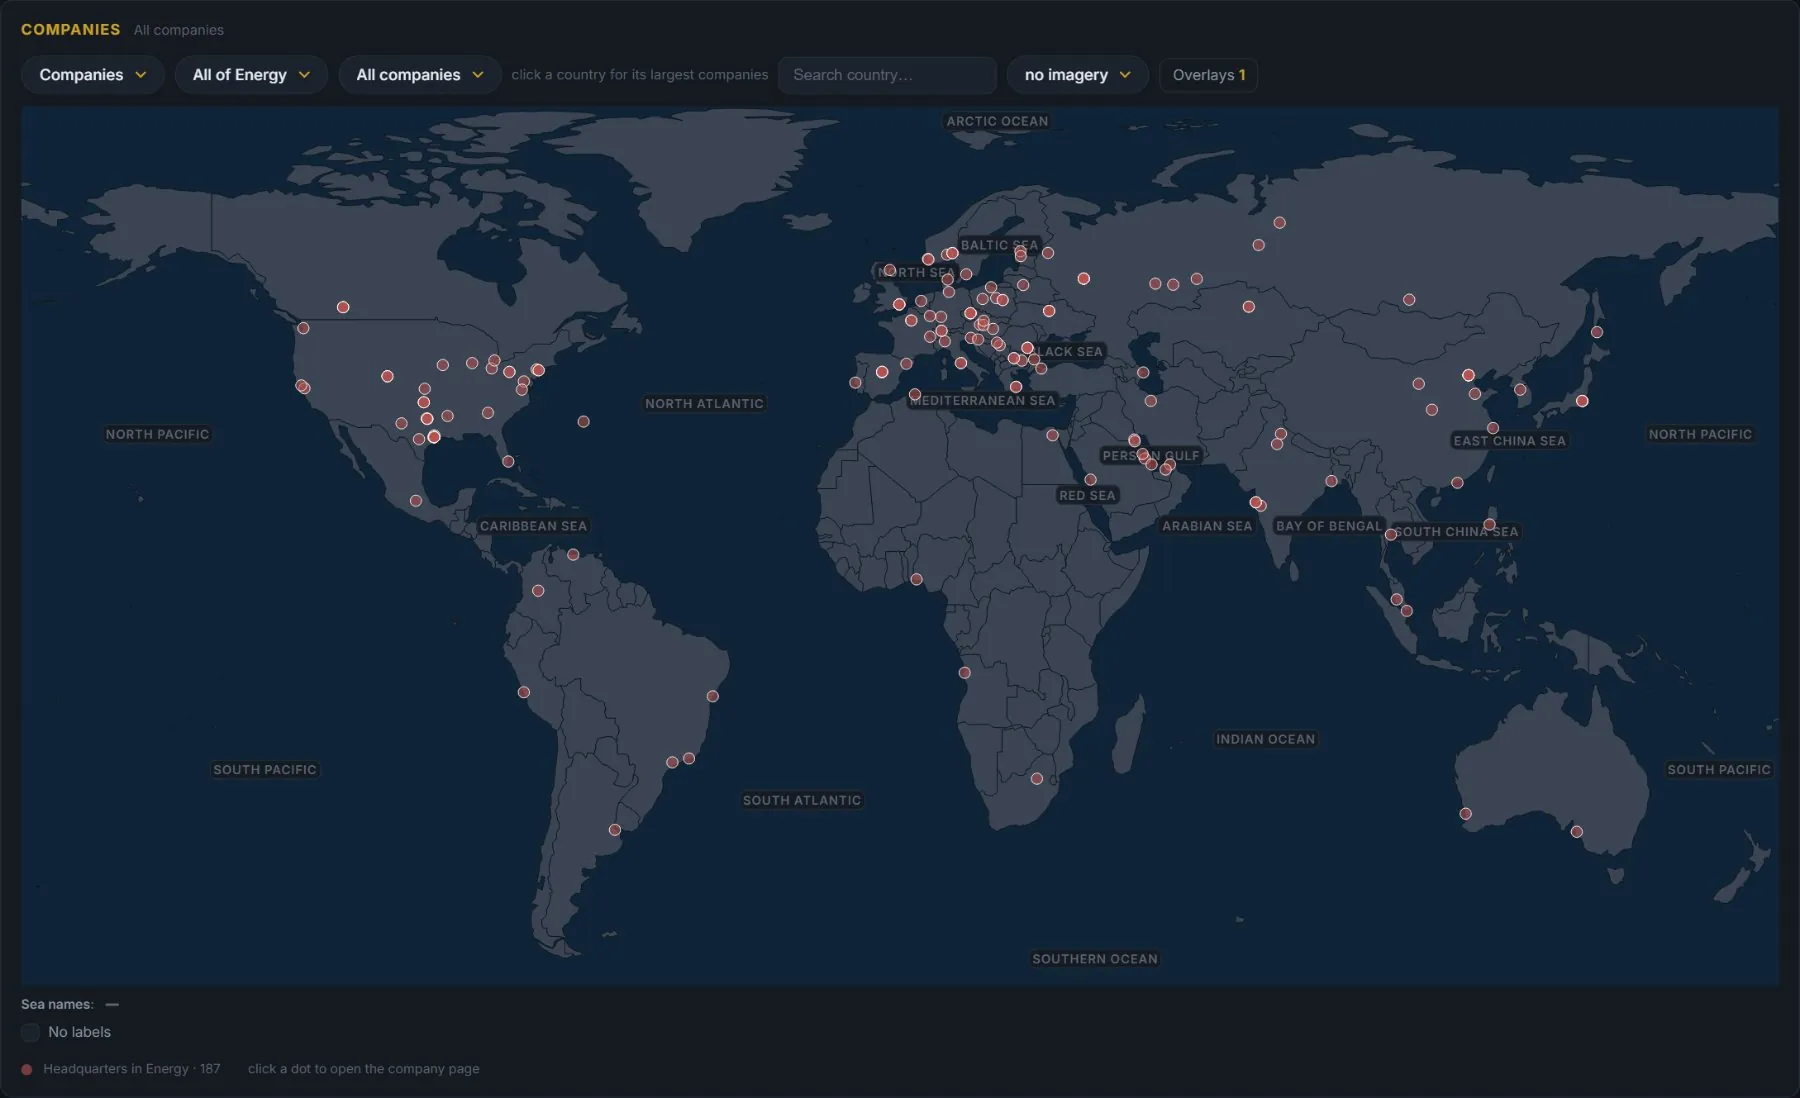
Every headquarters on one map
The companies map shows where the companies of a sector are based — here all of energy.
- 4,700+ companies in eleven sectors, from oil & gas to software and banking.
- Filter by sector and sub-sector, or pick one company to see its subsidiaries, sites and branches.
- Click a country for its largest companies, a pin for the company page.
- The same backgrounds and overlays as every other world map in DESK.
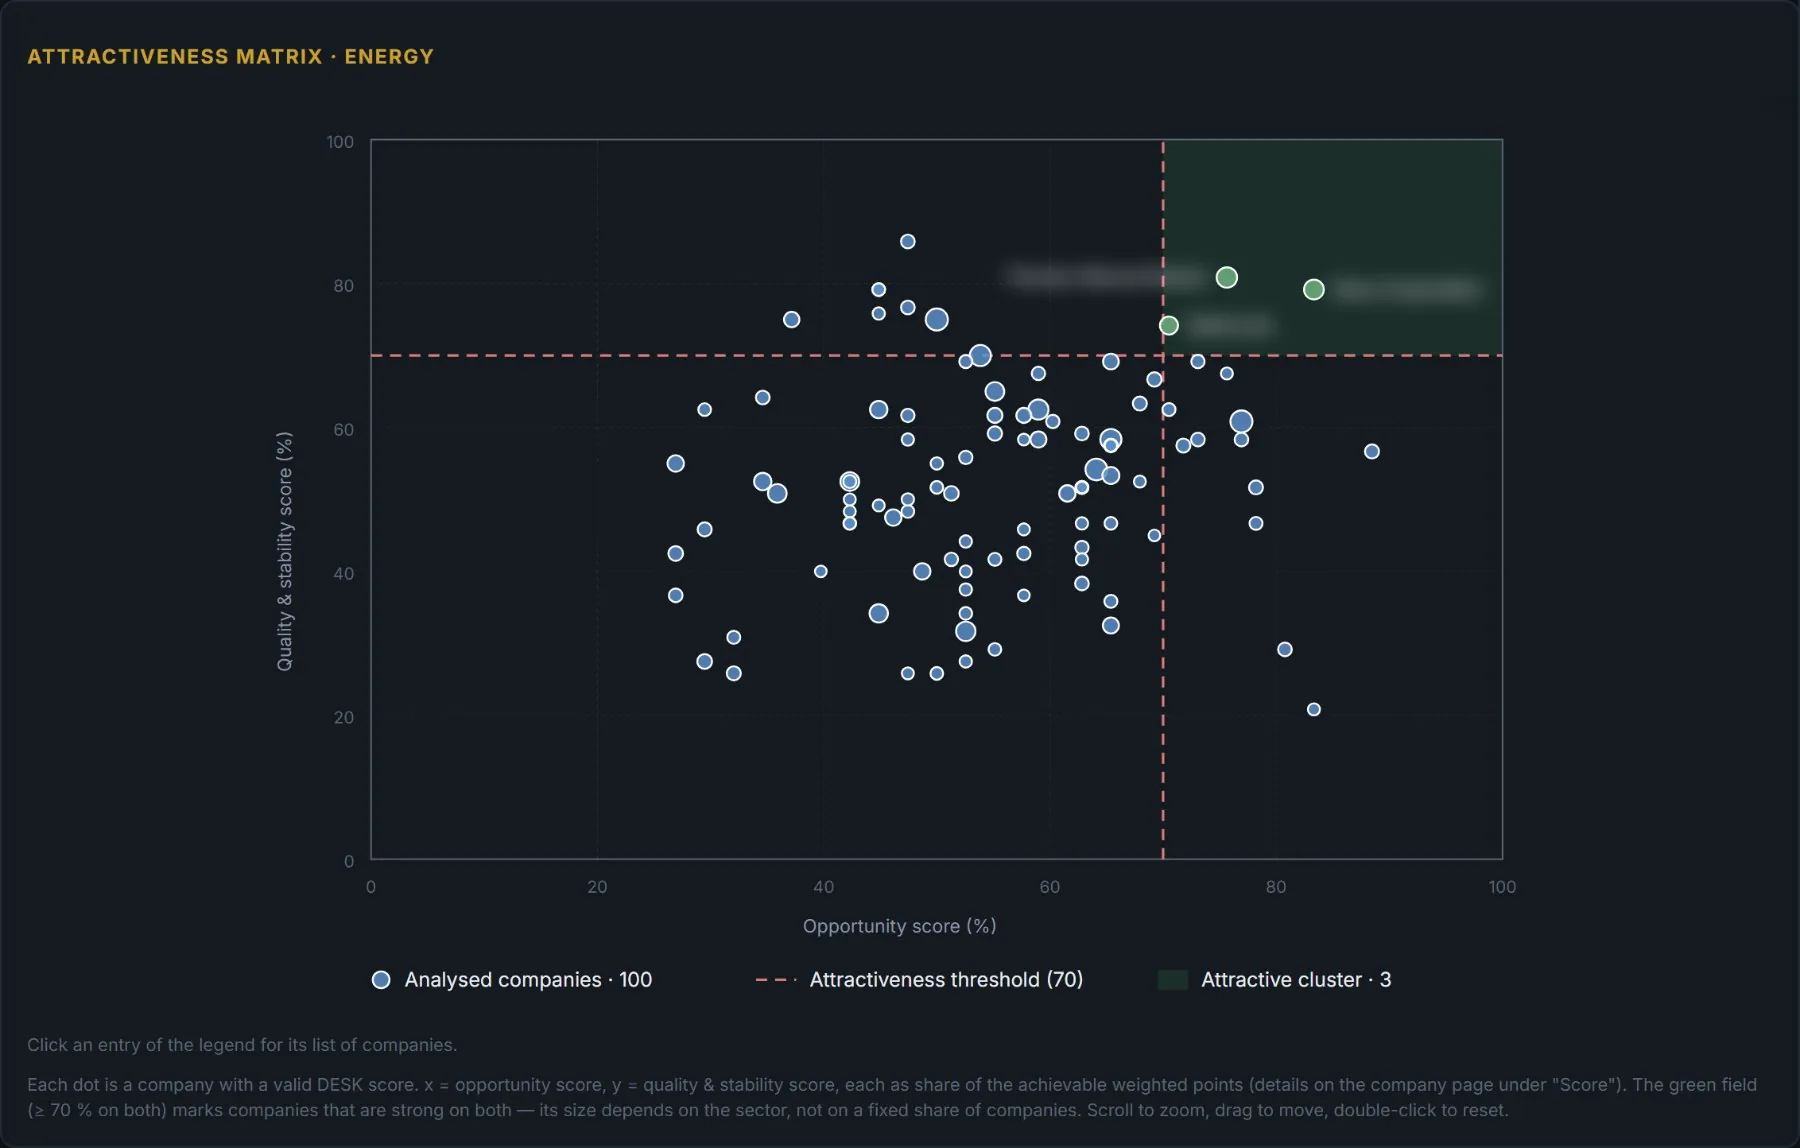
Where opportunity meets quality
Every company with a DESK score is placed by two numbers taken from its reported figures: how much opportunity it shows, and how solid it is.
- Points come from the data and are ranked within the company’s own sector — no fixed limits.
- The dashed lines mark 70 % on both scores; companies above both land in the green cluster.
- Every dot opens its company page, with the full score table behind it.
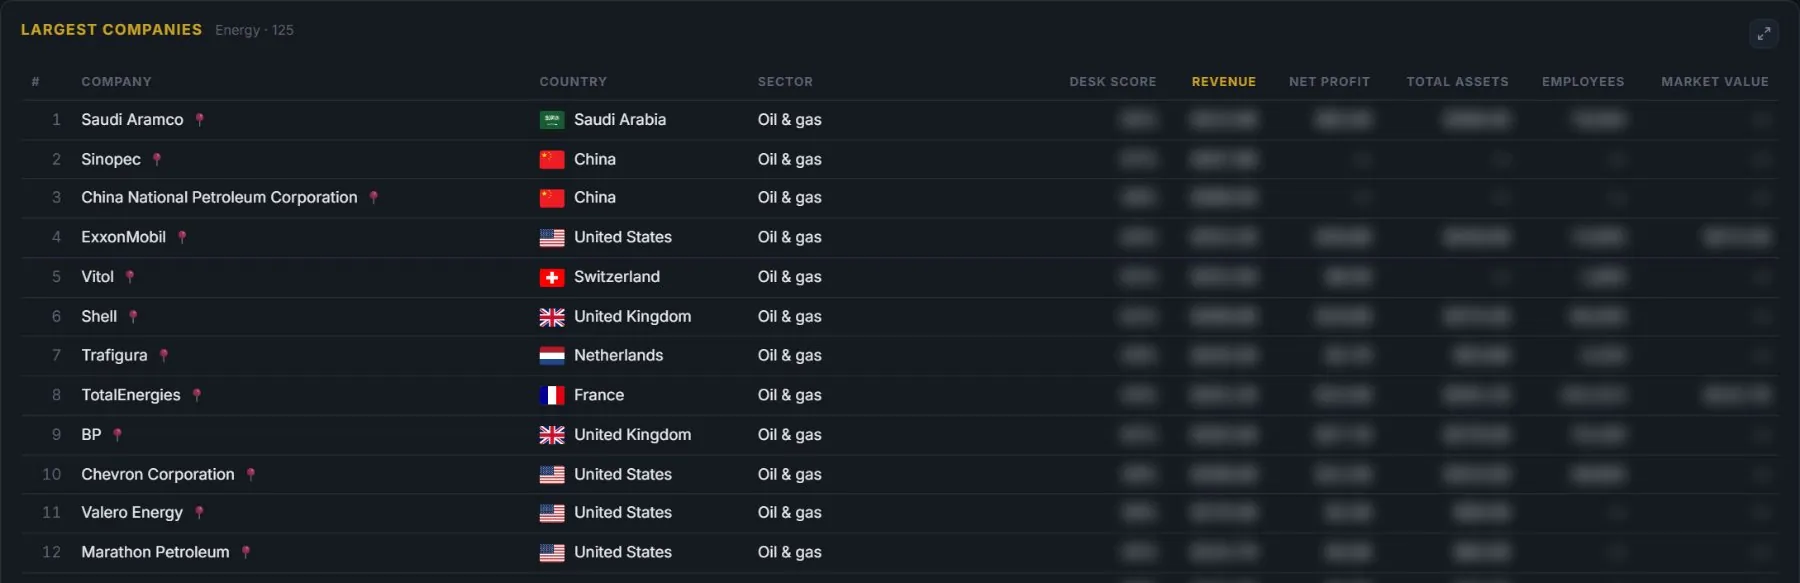
The largest companies of a sector
Ranked by revenue, with the figures that matter next to each other.
- DESK score, revenue, net profit, total assets, employees and market value.
- Sort by any column; every figure opens its history.
- The pin next to a name shows the company on the map.
- Market value fills in with live market data in DESK Pro.
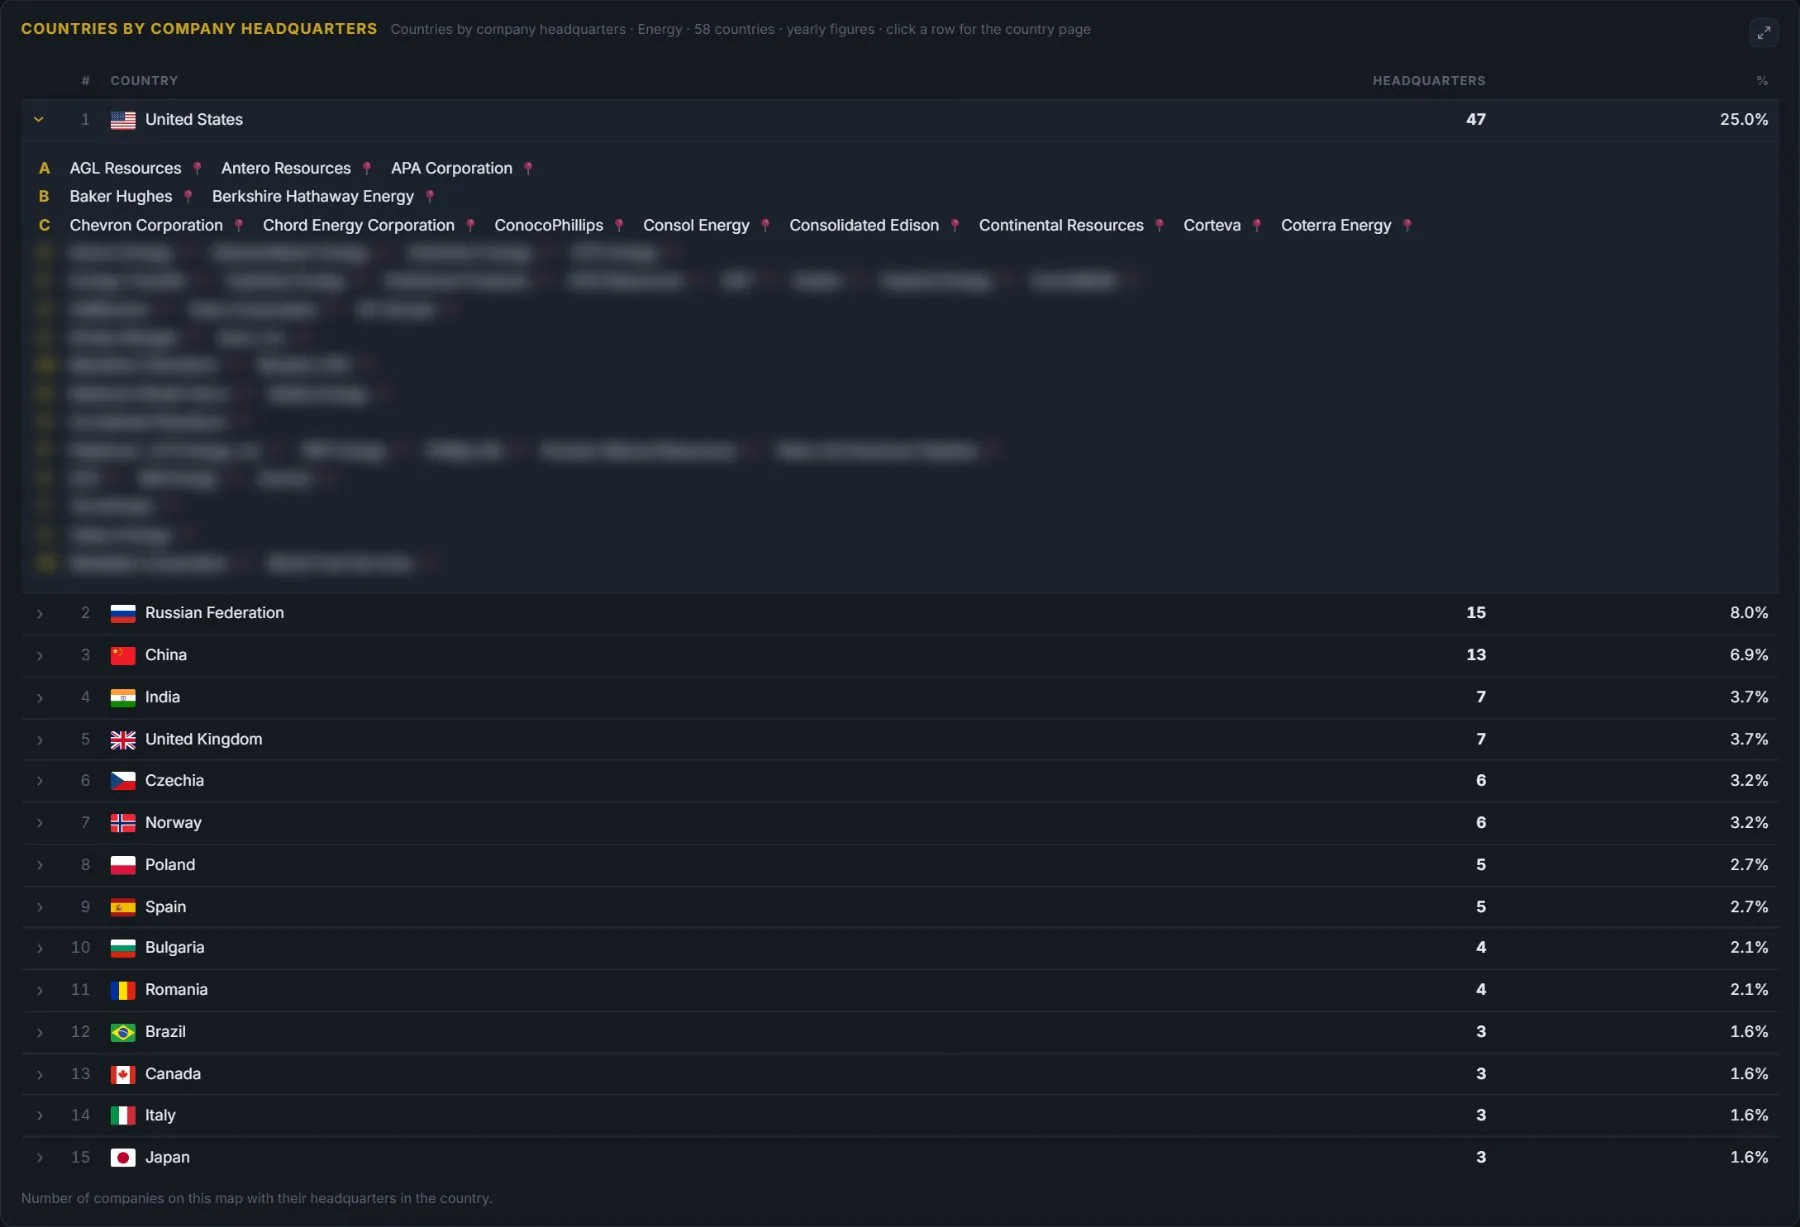
Where a sector is based
How many of a sector’s companies have their headquarters in each country, and which ones.
- Open a country to see its companies from A to Z.
- Each name opens the company page; the pin shows it on the map.
- The country name leads to the country page.
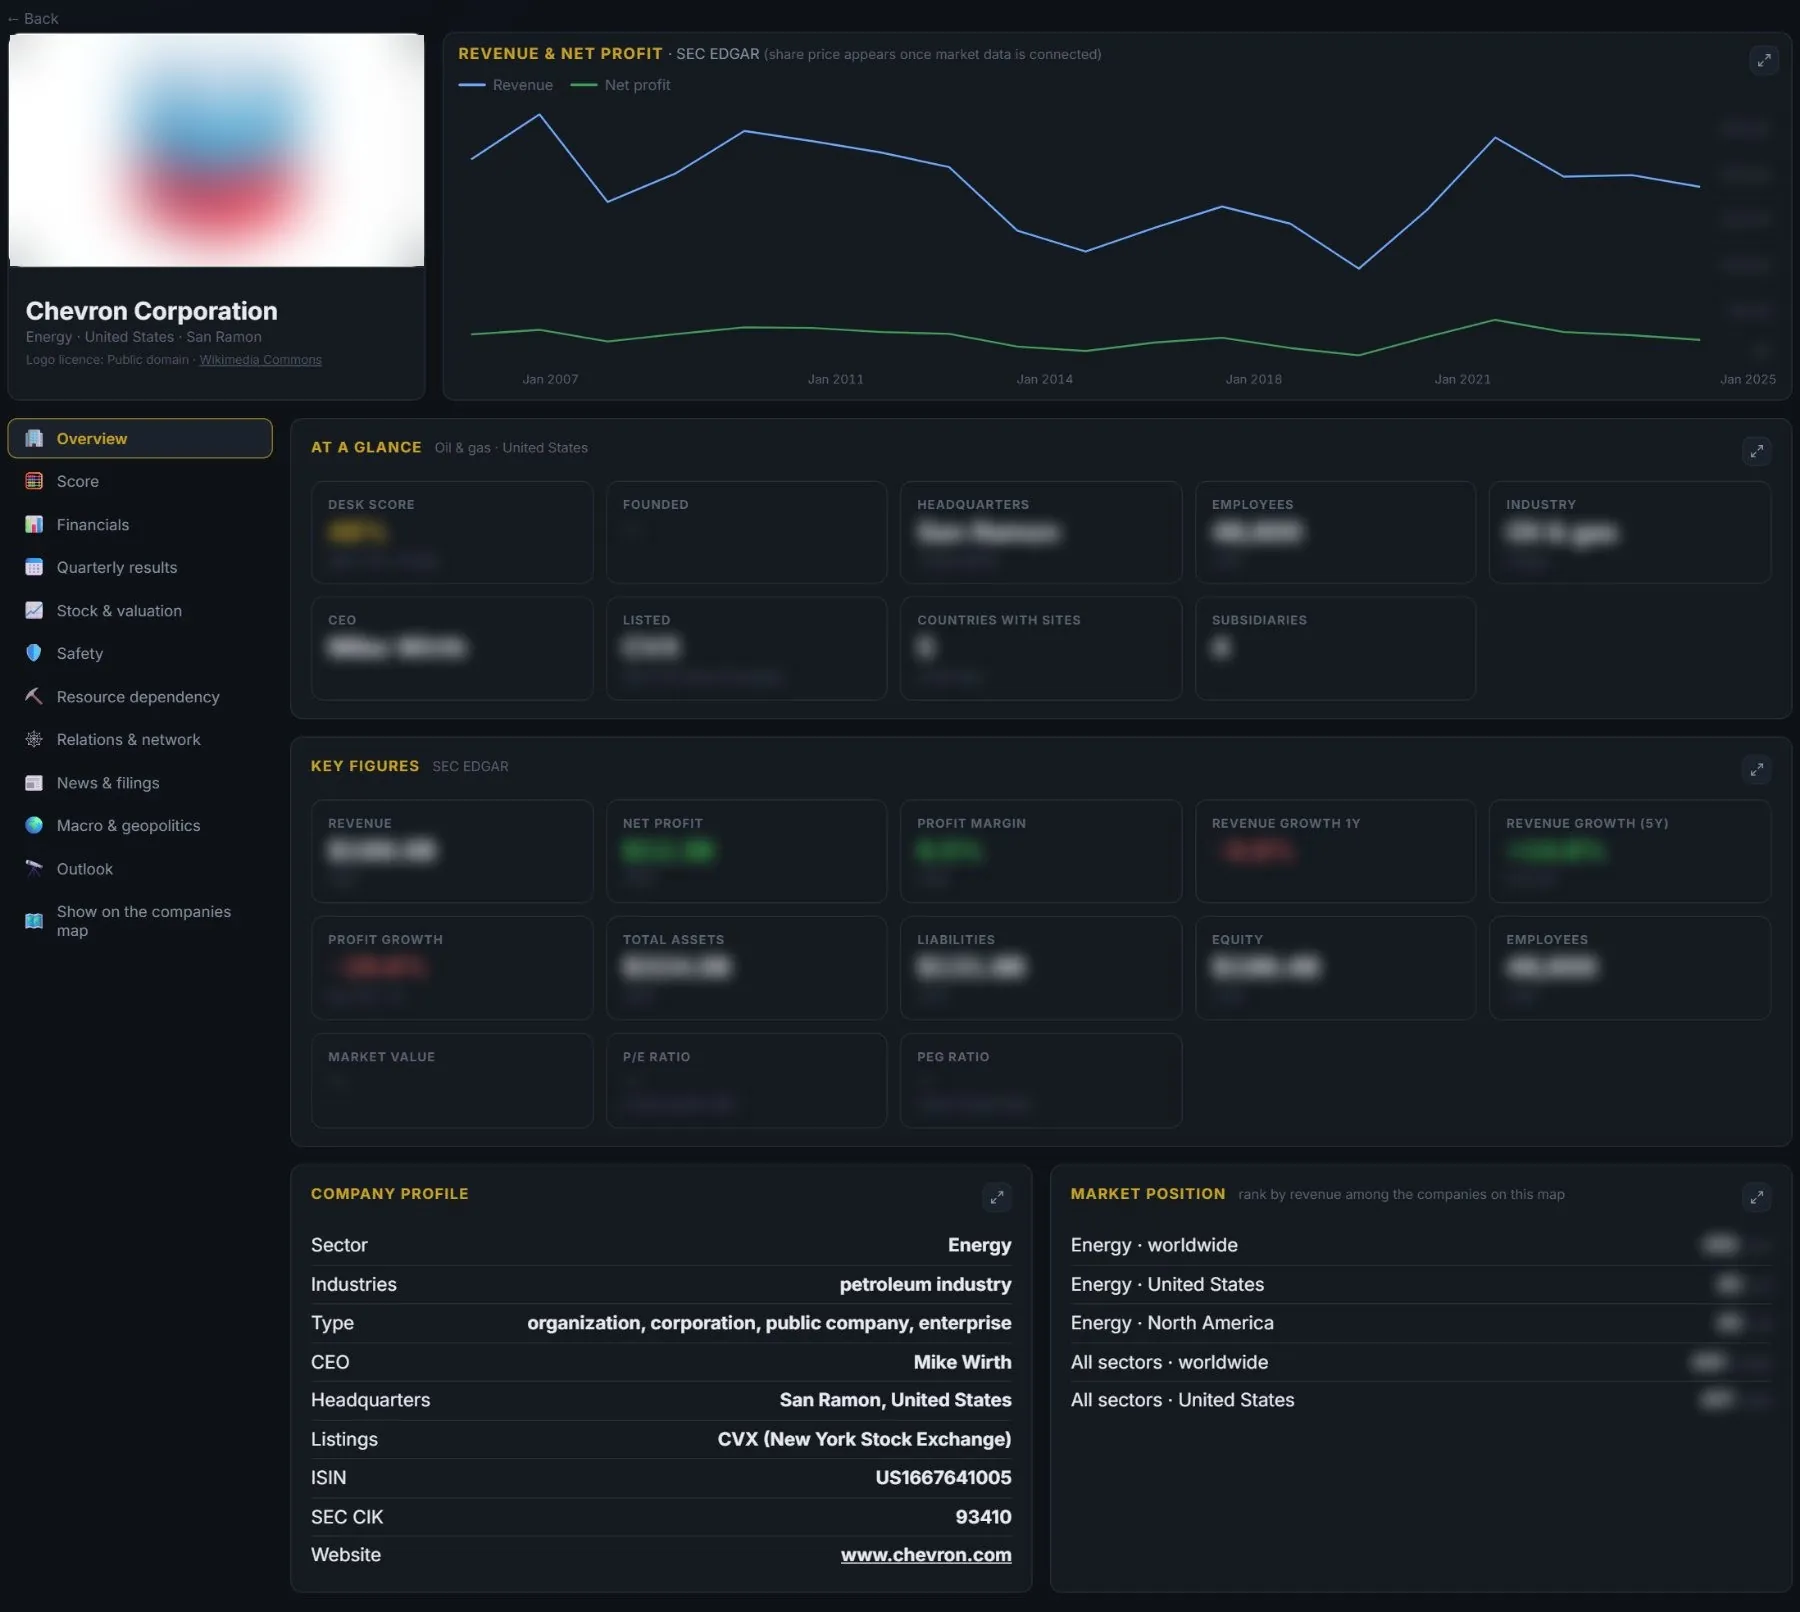
One page per company
Laid out like the country pages: a header with the logo and the revenue history, then chapters you can go through.
- Revenue and net profit from the company’s own SEC filings, back to 2007.
- At a glance: DESK score with its rank in the sector, employees, CEO, listing, sites and subsidiaries.
- Chapters for score, financials, quarterly results, stock & valuation, safety, resource dependency, relations, news & filings, macro and outlook.
- Market position: the company’s rank by revenue in its sector, its region and worldwide.
Built on
named on every panel in the appSEC EDGAR · Wikidata · USGS · World Bank