Sounds familiar?
What gets in the way today.
The data sits on twenty websites.
World Bank, OECD, Eurostat and central banks behind one search.
Every source uses a different year and unit.
Year and unit are printed on every panel.
Comparing countries means building a spreadsheet.
Up to six countries on any of 900+ indicators.
You notice a shift only after prices moved.
Release calendar and business cycle position in the same place.
With DESK
What changes.
01
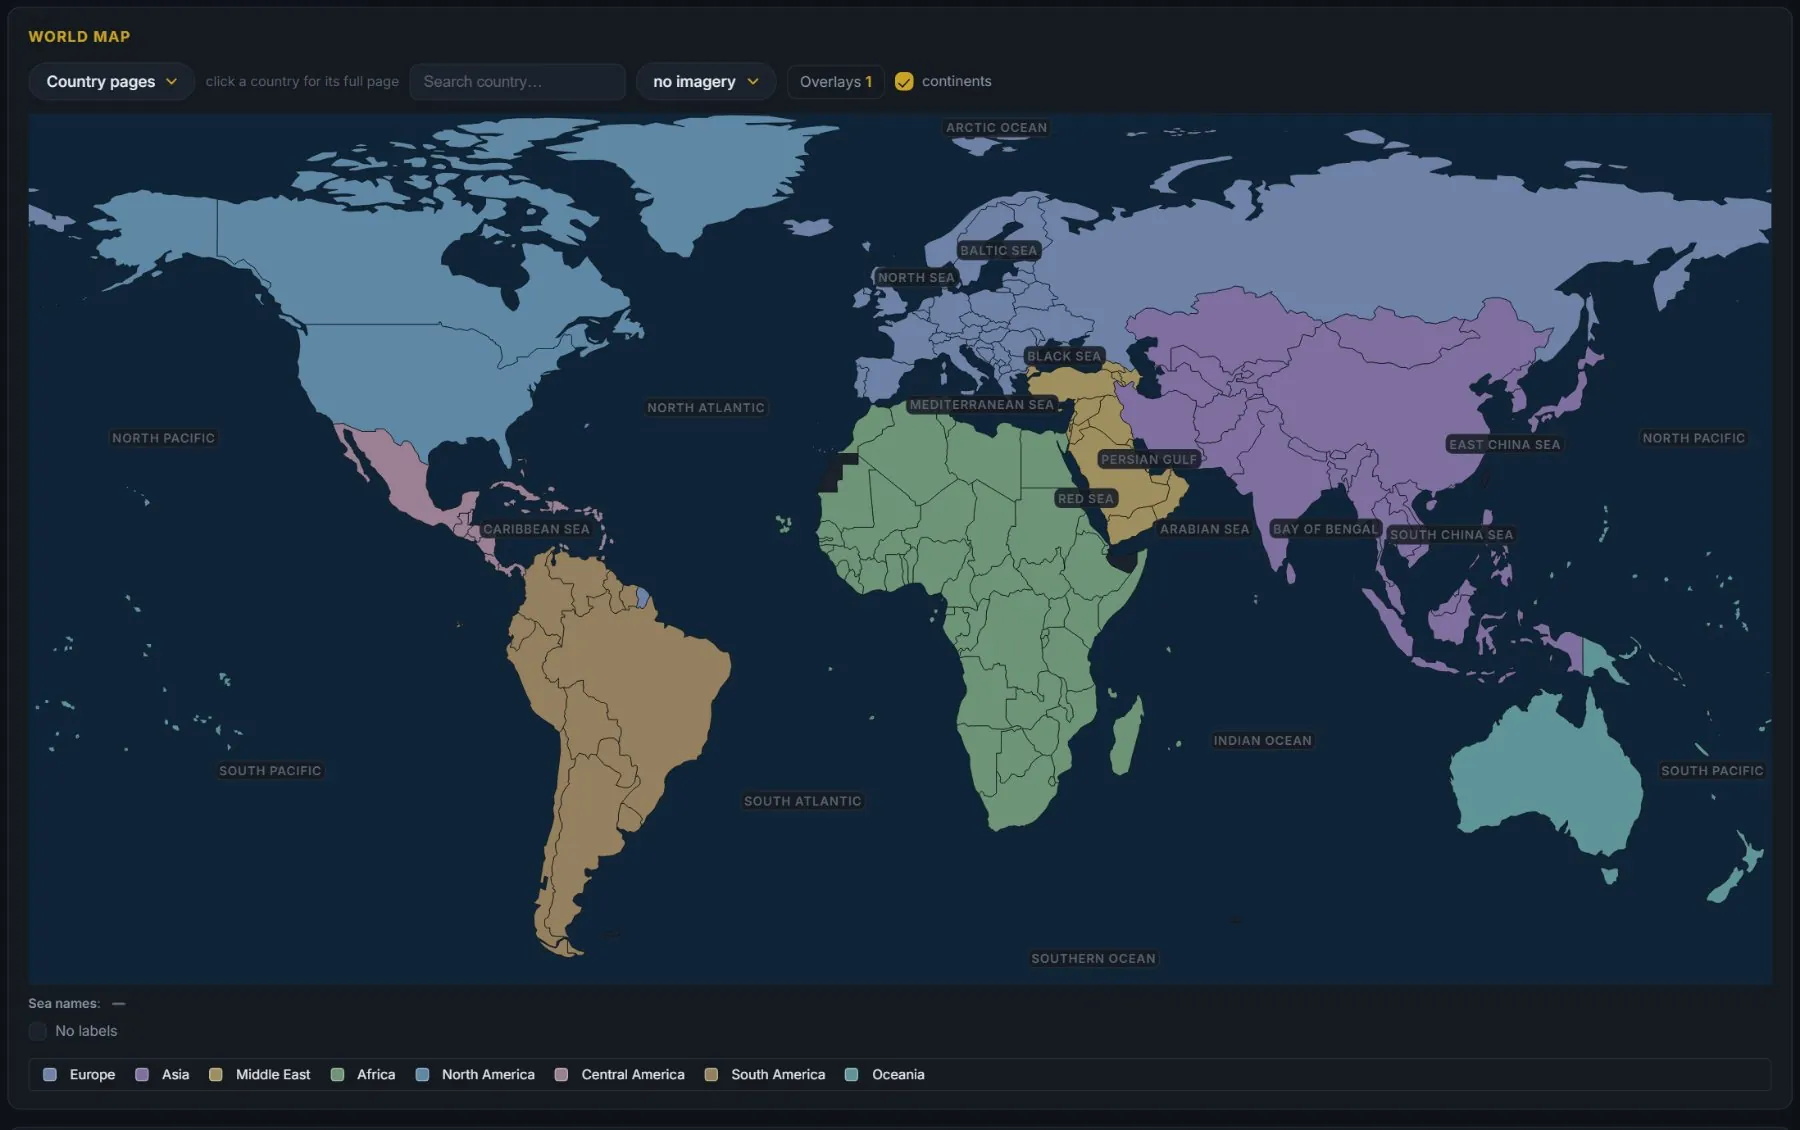
Scan a theme across the world
Pick an indicator and the world colours itself. Move the time slider to see how it got there, or filter the table with a formula like “inflation < 2 and growth > 3”.
Macro Terminal →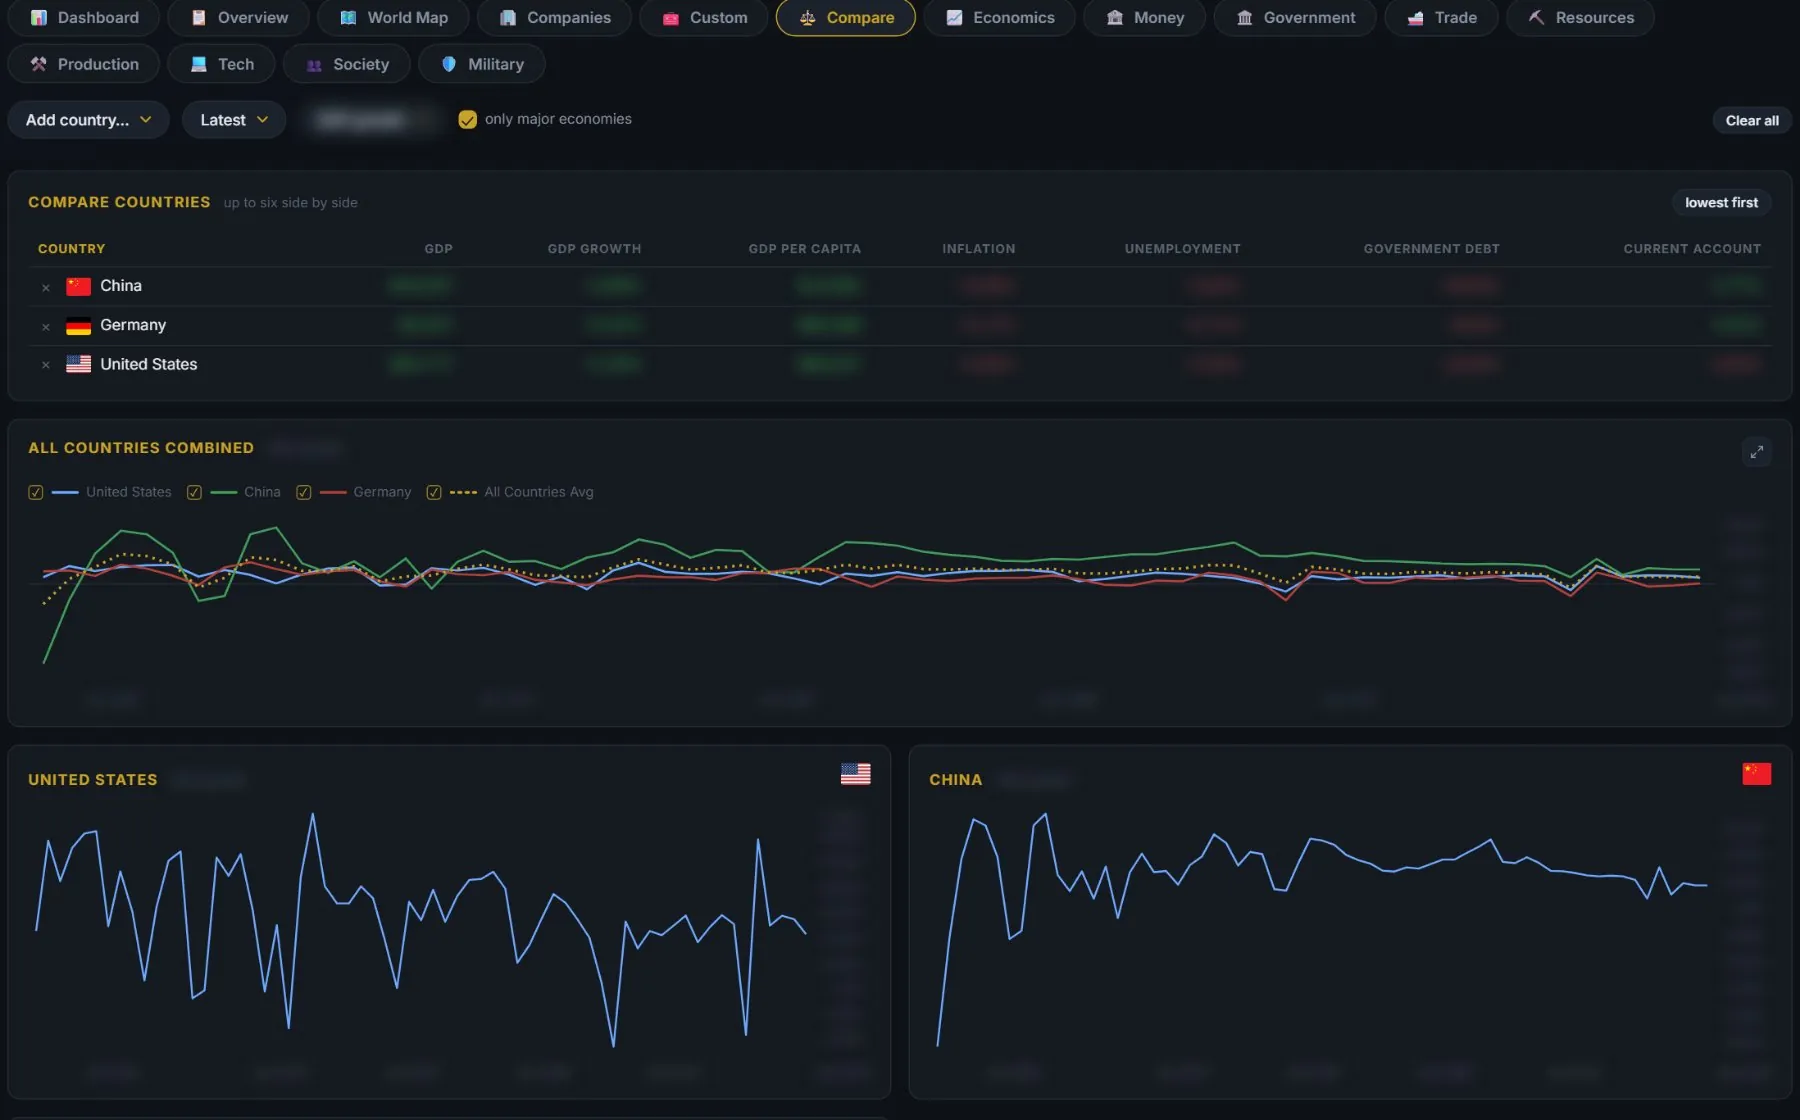
02
Line up the candidates
Put the countries you are weighing side by side and look at the same indicators over the same years.
Macro Terminal →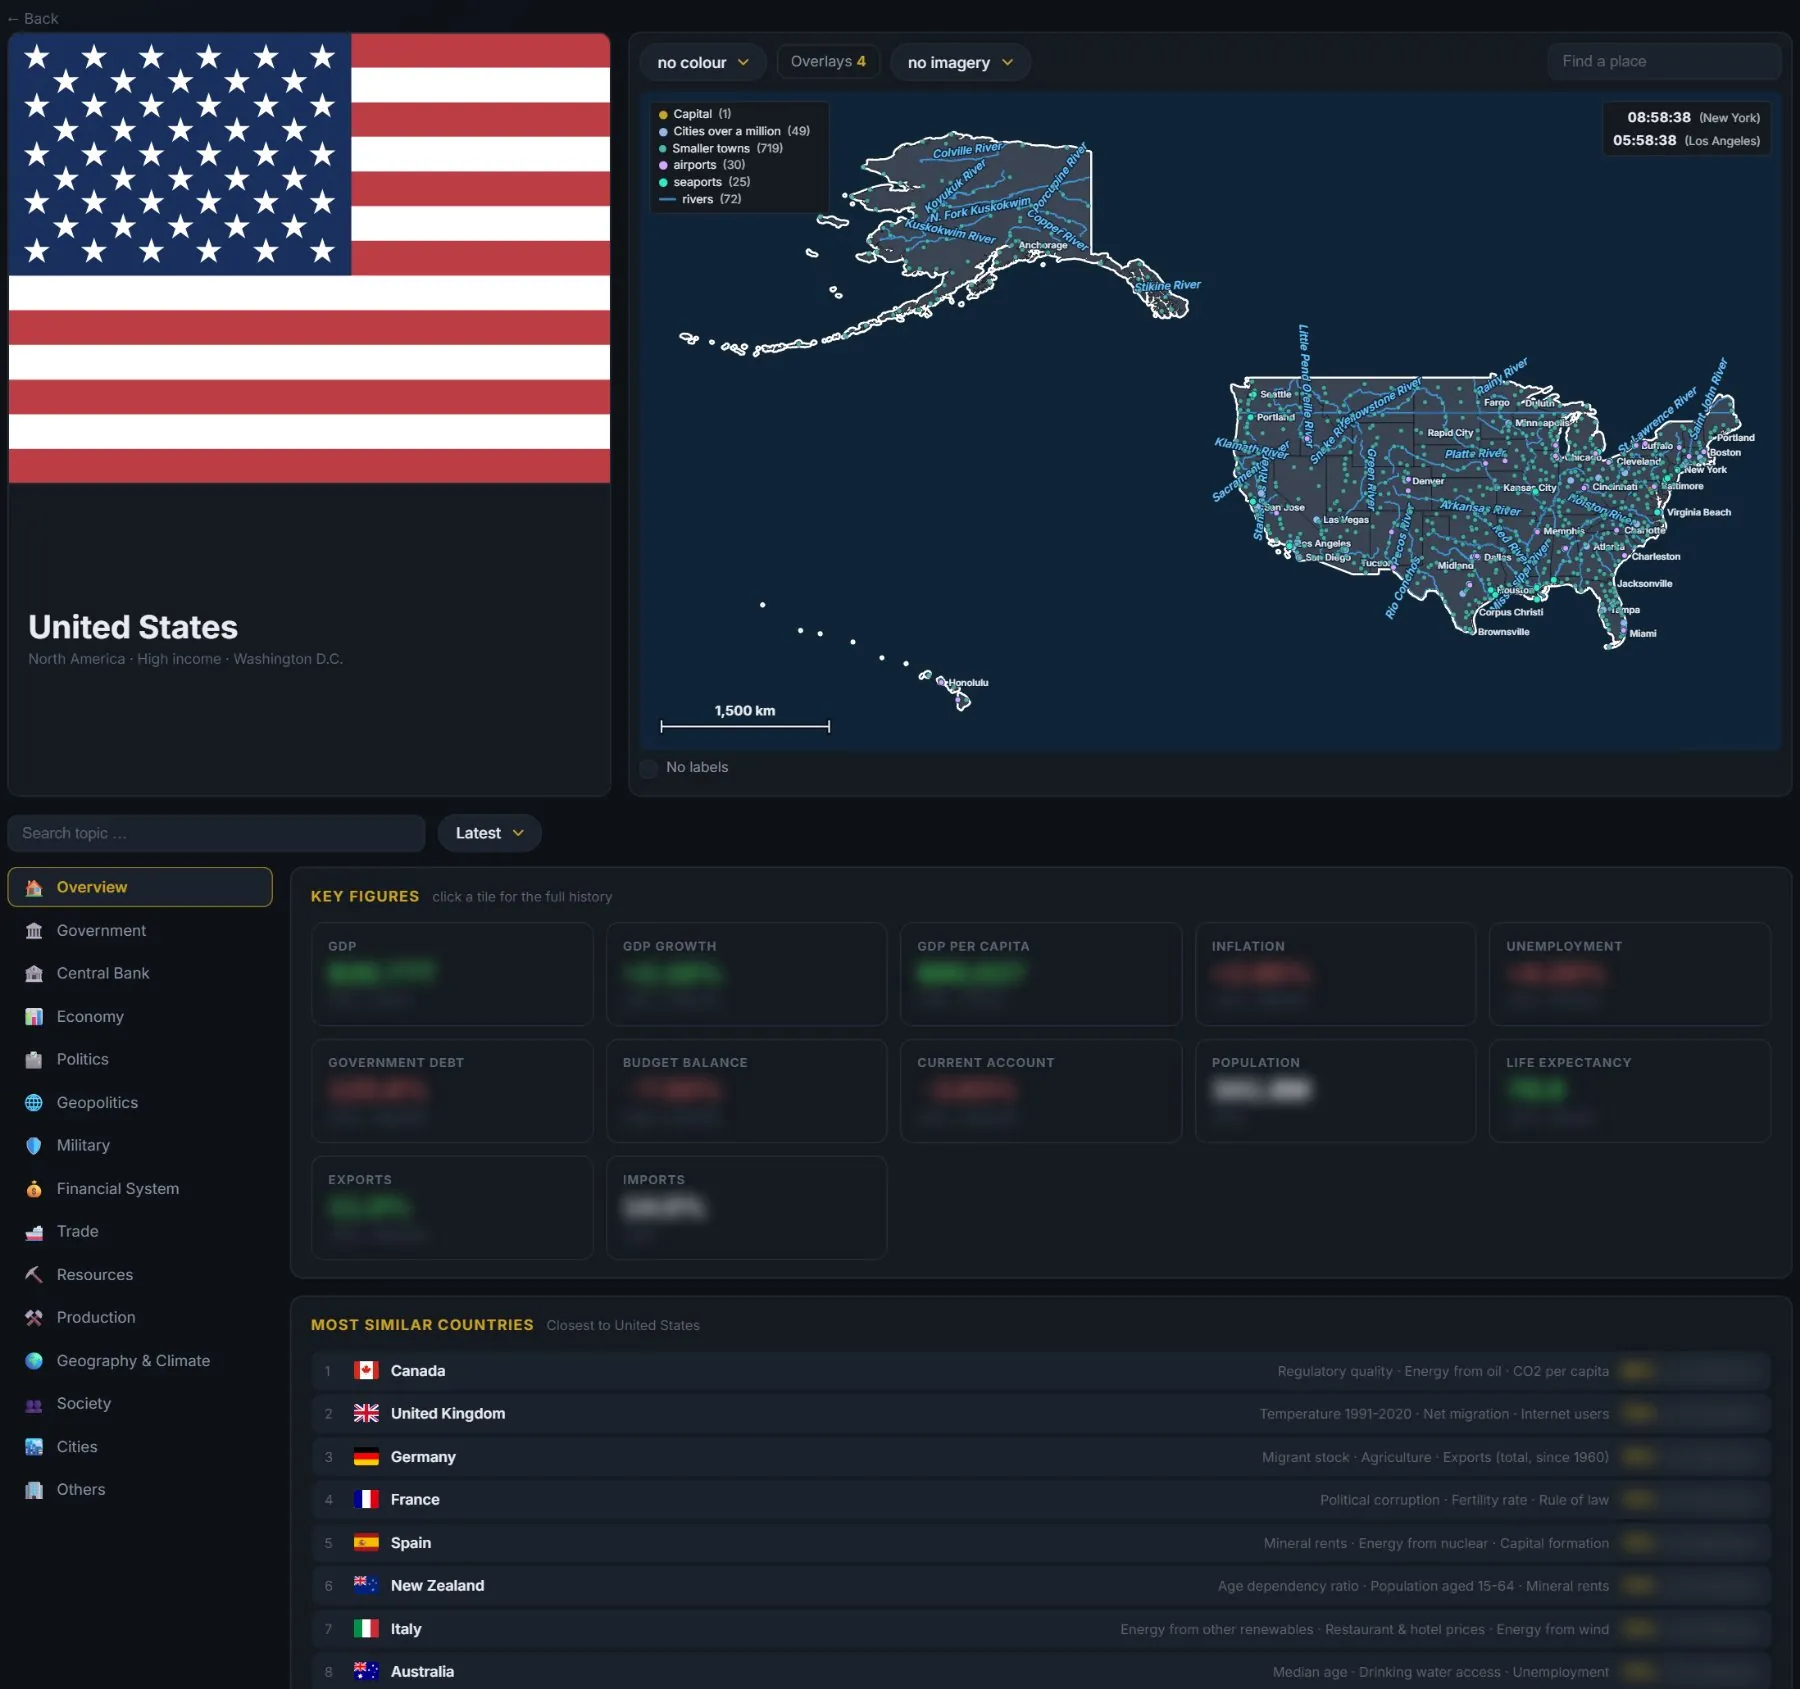
03
Read one economy end to end
Government, central bank, trade, resources and society on one page — plus the countries that look most alike, with the reasons why.
Macro Terminal →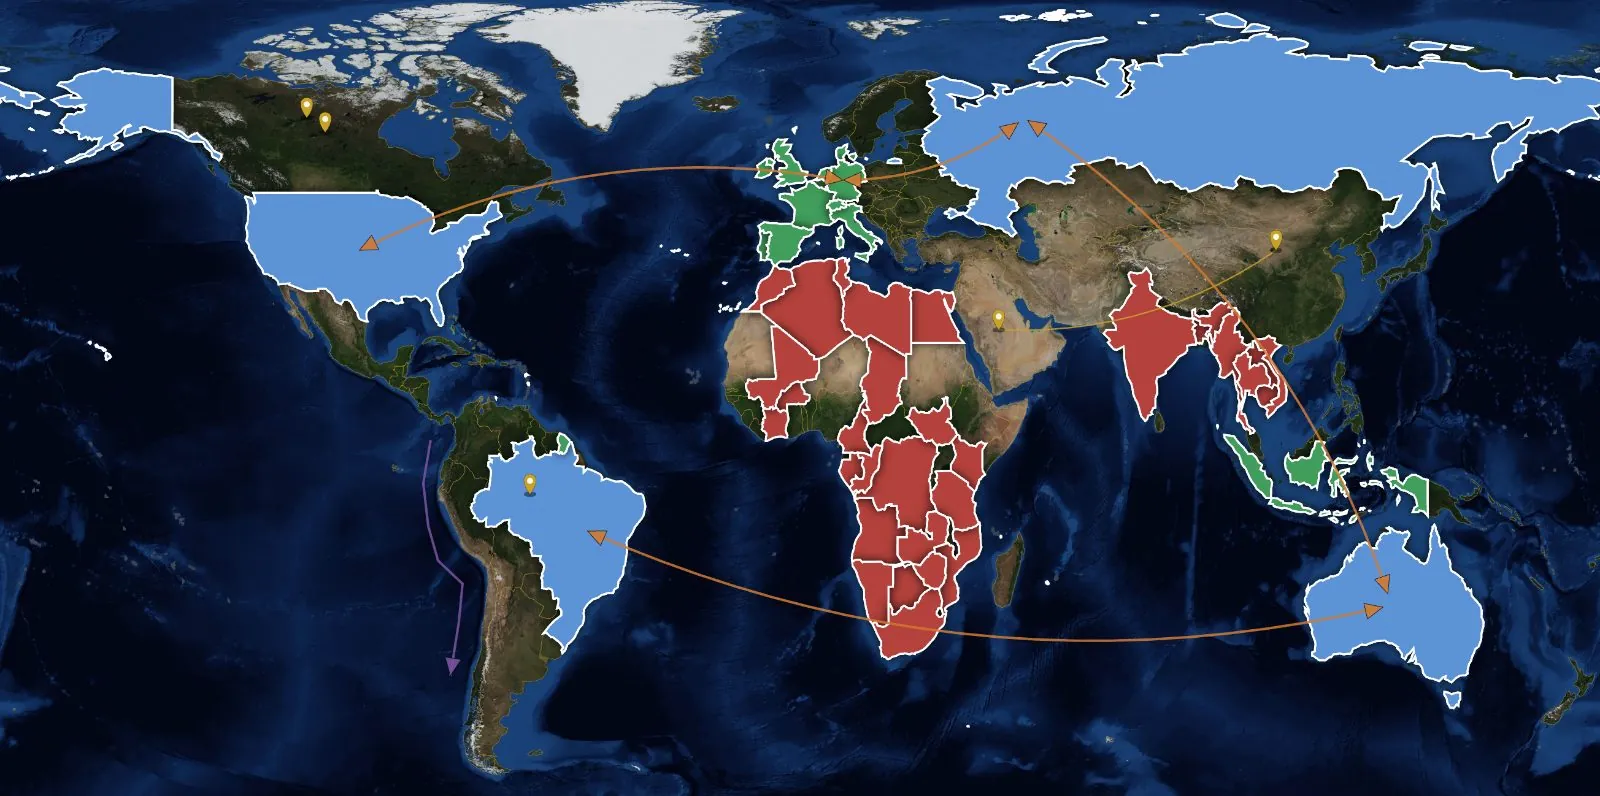
04
Keep your own watch map
Colour the countries you follow by rules you write, add places and routes, and come back to the same picture every week.
Your own map →A routine
How a week can look.
- Monday
Scan the indicator map for what changed since the last release.
- Midweek
Check the release calendar: the previous value, and the actual when it lands.
- Before positioning
Compare your candidates on the same six indicators.
- Month end
Update your own map and look where the business cycle has moved.
Where to start
Three steps for the first hour.
What DESK doesn’t do
Official statistics lag. DESK shows the latest published year and says which one it is — it doesn’t fill gaps with estimates.
Related