Sounds familiar?
What gets in the way today.
Screeners show ratios, not the company.
Reported figures over time, straight from SEC filings.
A filing is hundreds of pages.
The numbers that matter on one page, with the year beside them.
Risks show up after the drop.
Loss years, the worst revenue fall and dependencies, up front.
Peers are hard to line up.
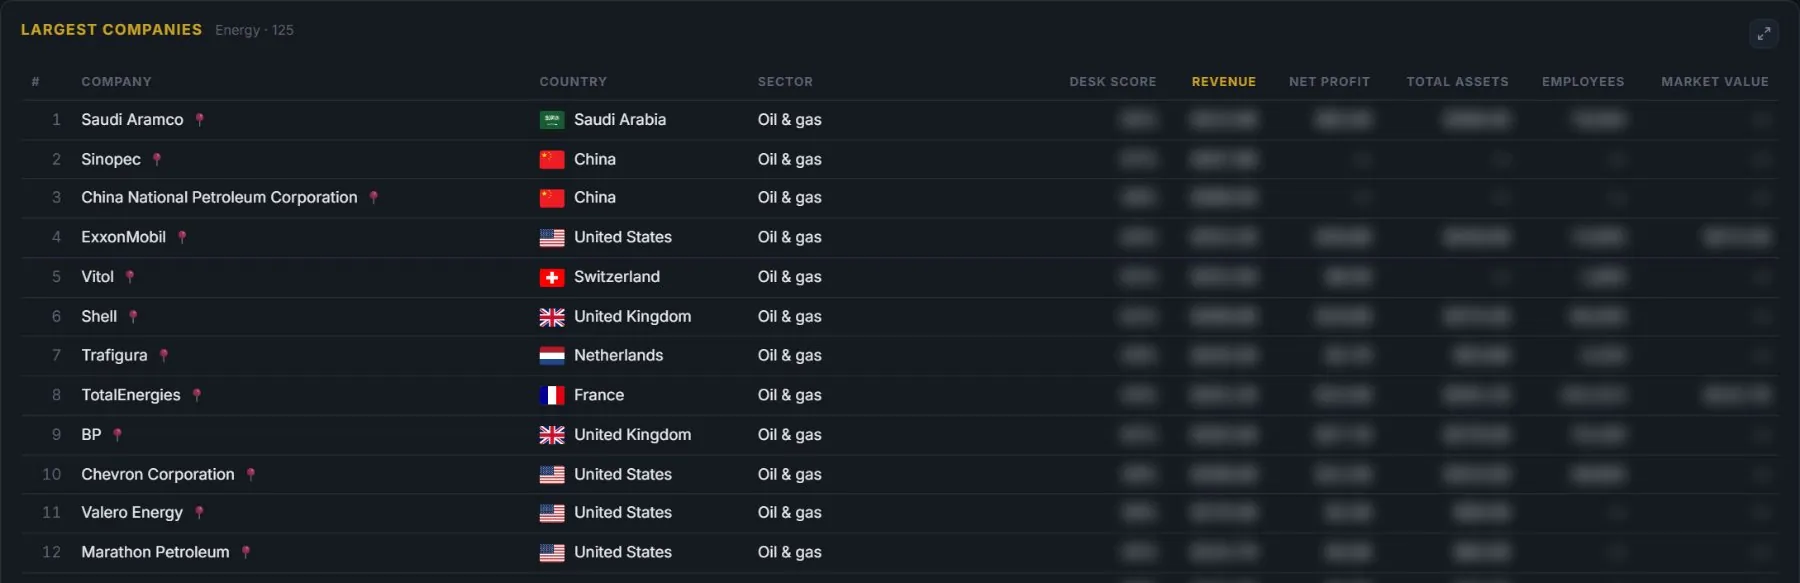
Companies ranked by sector, with a points-based DESK score.
With DESK
What changes.
01
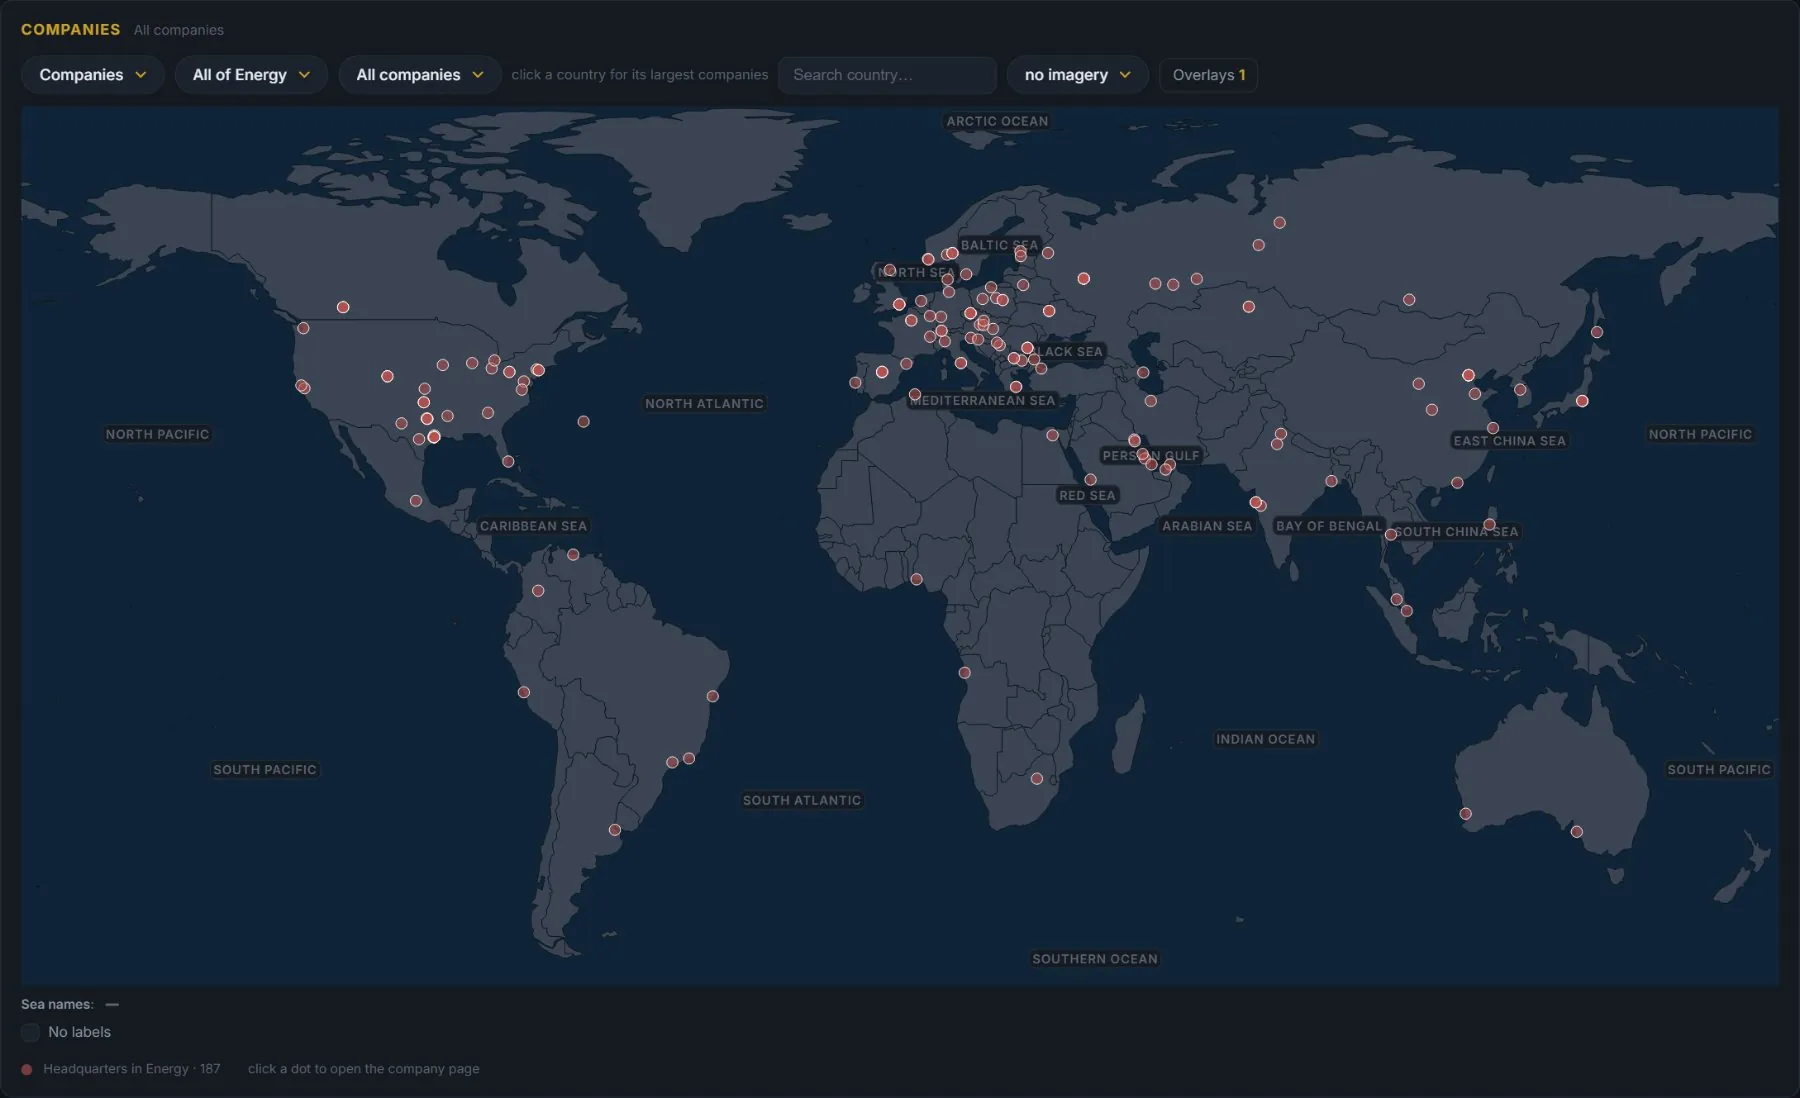
Start with the sector
Pick a sector on the map and see where its companies are based and which are the largest.
Company pages →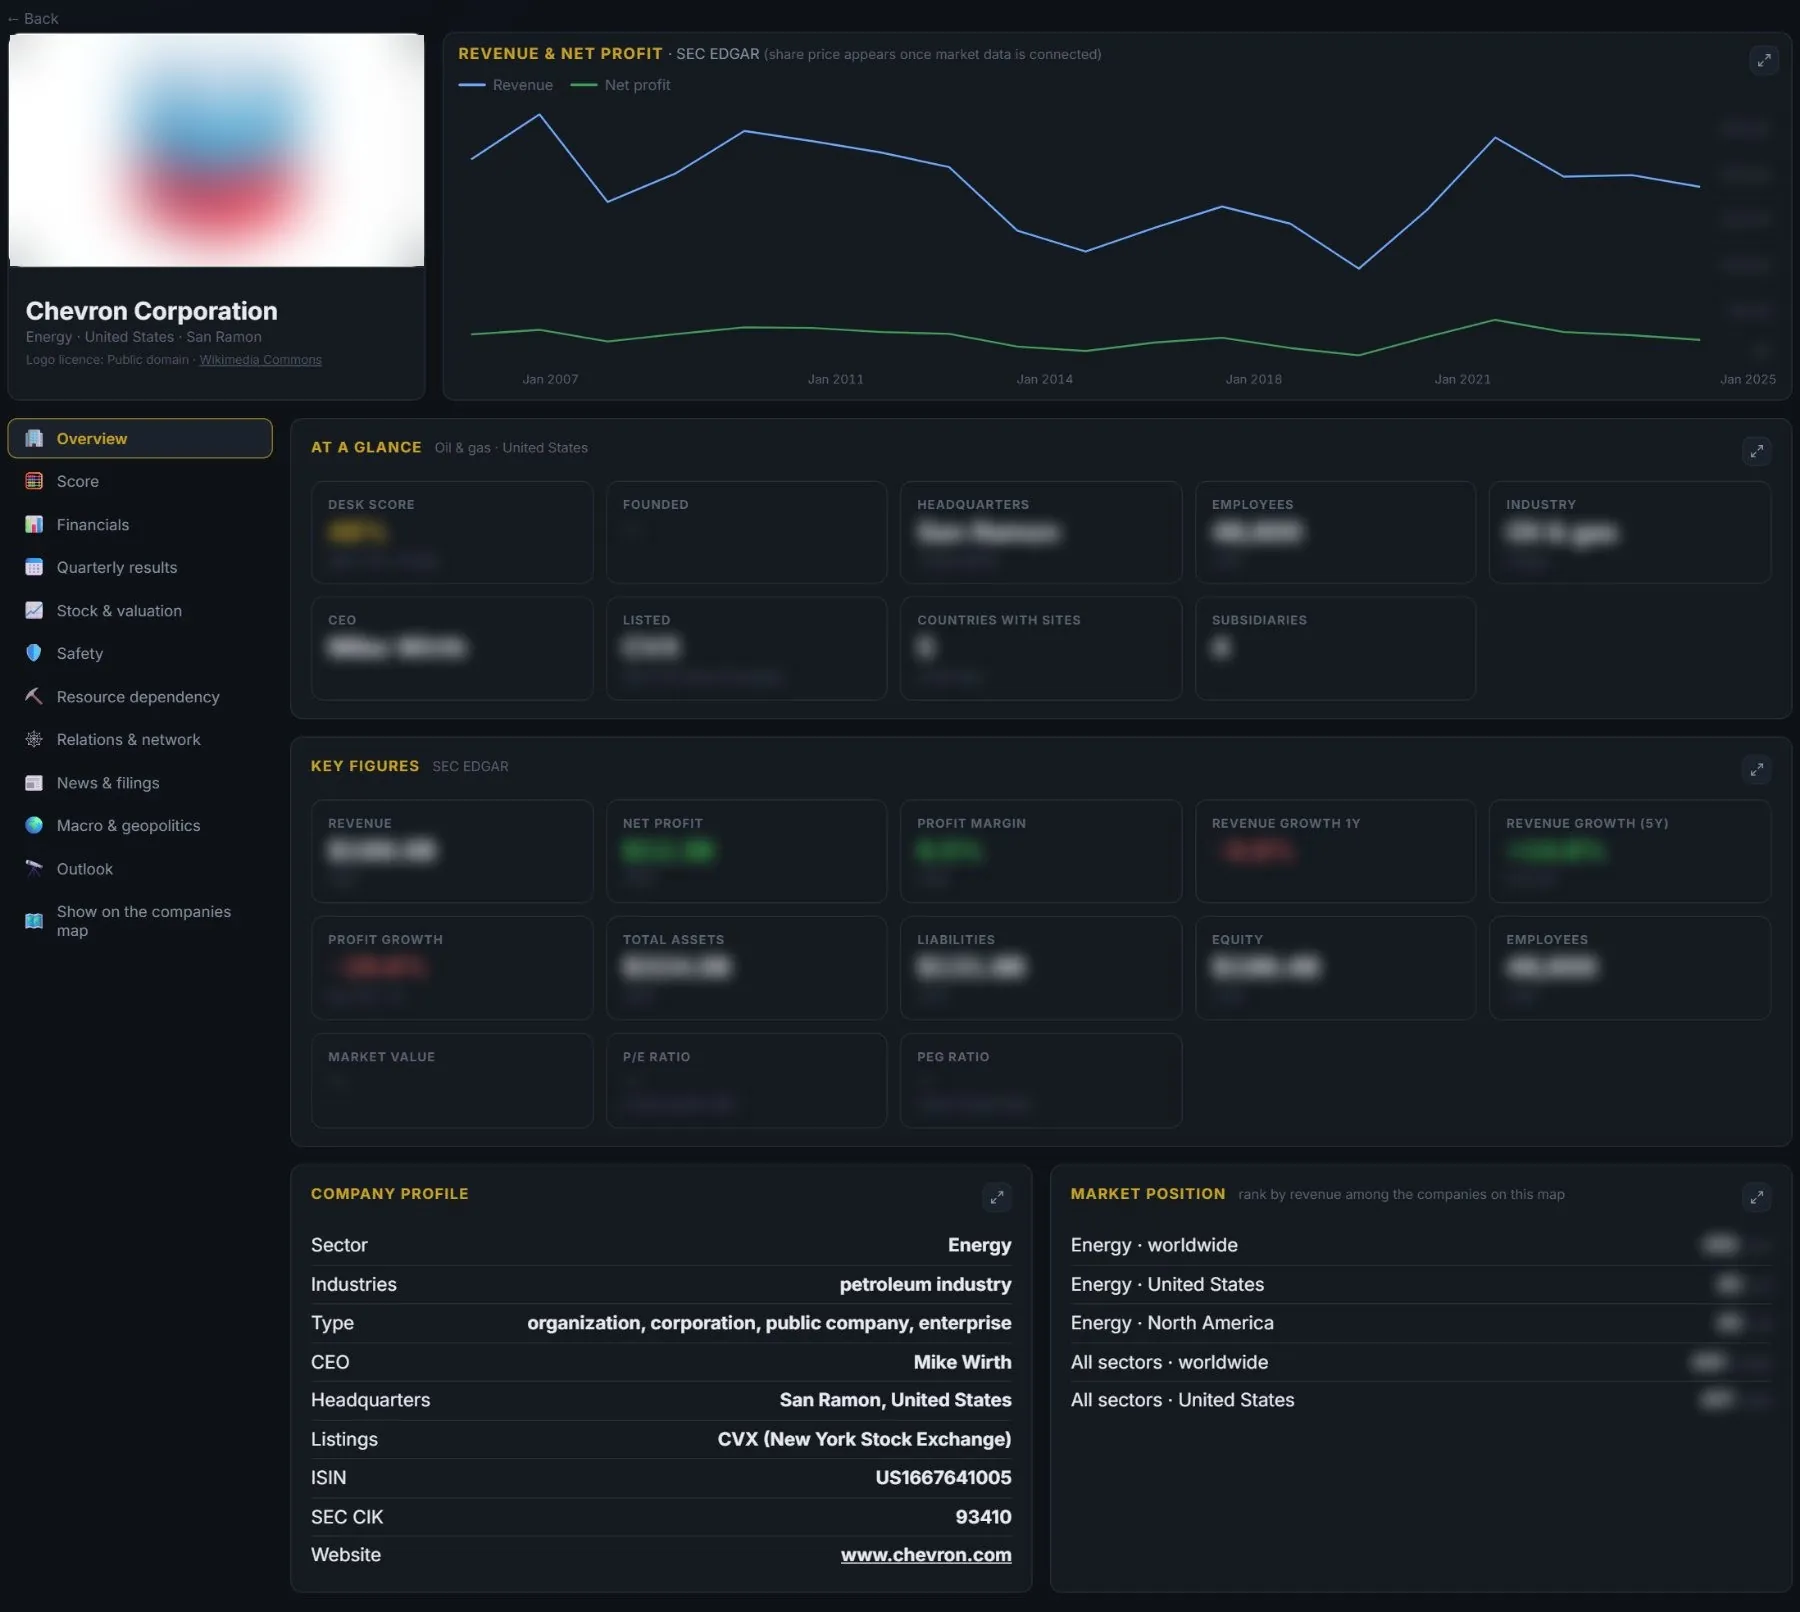
02
Read one company properly
Revenue and profit from the filings, quarterly results and the balance sheet — then how it came through past crises.
Company pages →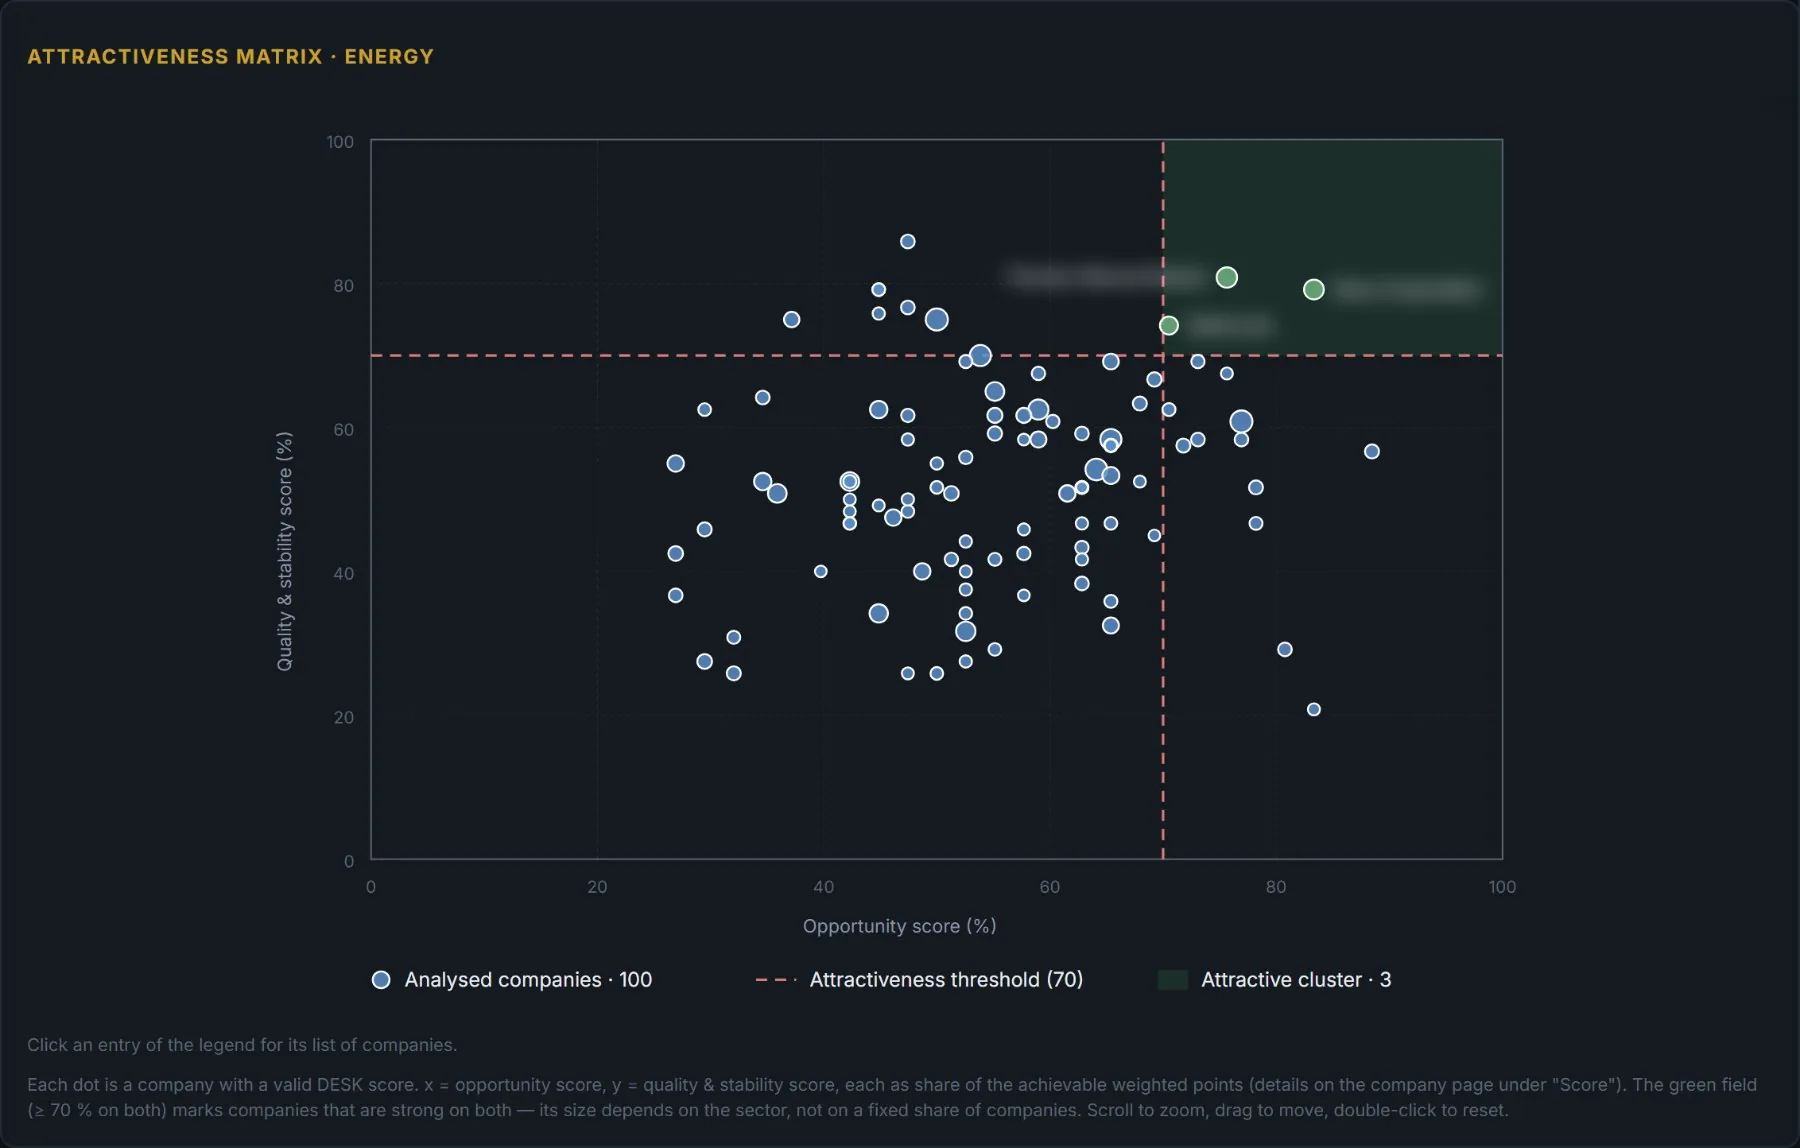
03
Place it among its peers
The DESK score adds points from the data and ranks the company within its sector; the matrix shows where it sits.
Company pages →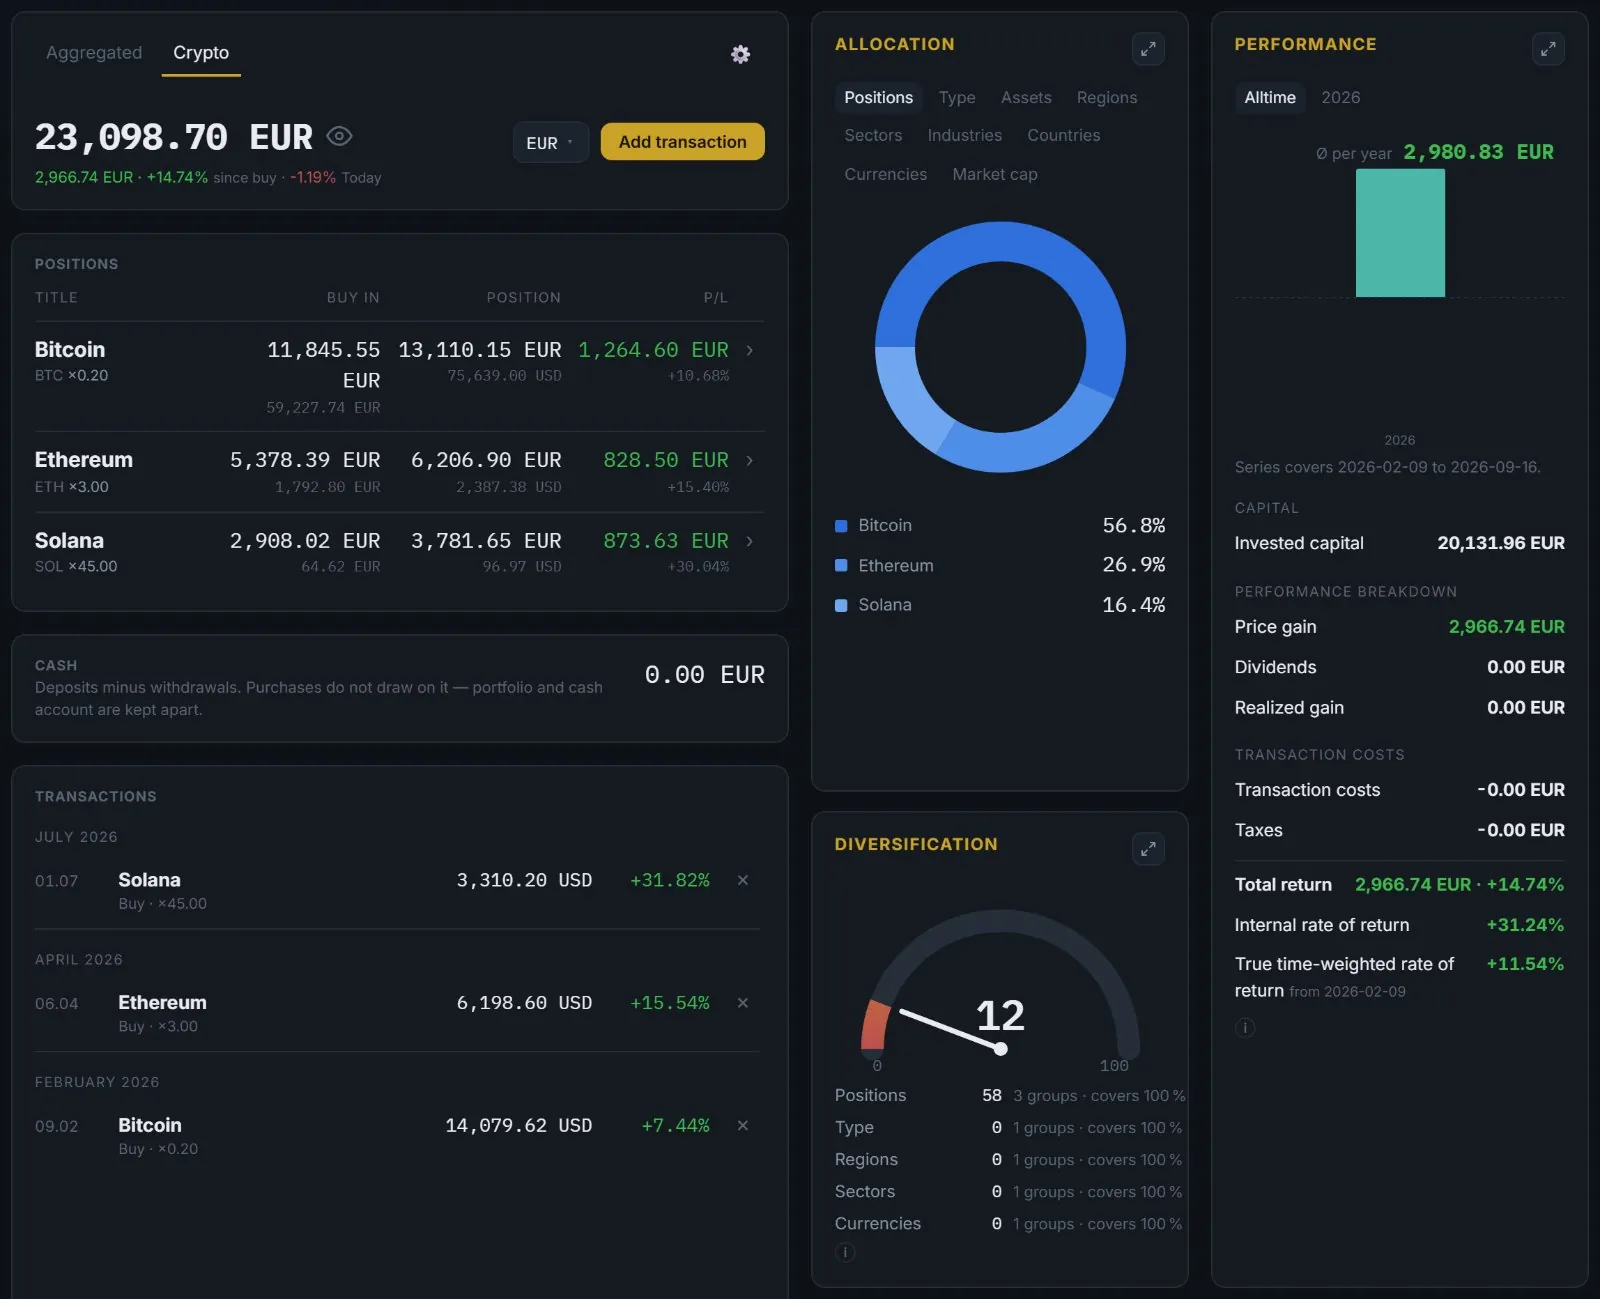
04
DESKPROKeep it on your list
Add it to your portfolio or watchlist and follow it in the currency you think in.
Portfolio →A routine
How a week can look.
- An evening
Pick a sector and note the three companies you have never looked at.
- Weekend
Read two company pages end to end — filings first, story second.
- Before buying
Check the crisis history and the countries it depends on.
- After buying
Write down in your journal why you bought it.
Where to start
Three steps for the first hour.
What DESK doesn’t do
Share prices, valuation ratios and market value come with DESK Pro, once live market data is licensed. Until then, DESK shows what the company reported.
Related