Research terminal · early access
The world's markets, on one desk.
Macro data, company research, crypto and your own trading journal: in one calm terminal, with every number traced to its source.
Early access · Official data · No investment advice
GDP per capita · world
World Bank · current US$ · 2024 · example dataWorld aggregates
World Bank · 2024 · click a tile for the chartGDP per capita · world
World Bank · current US$ · 2024 · example dataWorld aggregates
World Bank · 2024 · click a tile for the chartGDP per capita · world
World Bank · current US$ · 1990 · example dataWorld aggregates
World Bank · 1990 · click a tile for the chart6 of 34 years shown · full series in DESK
6 of 34 years shown · full series in DESK
6 of 34 years shown · full series in DESK
6 of 34 years shown · full series in DESK
6 of 34 years shown · full series in DESK
6 of 34 years shown · full series in DESK
Free · every Saturday
The DESK weekly report + macro calendar.
Markets, releases and the biggest developments of the week, calculated from official data — and what is due next week. As a PDF, in English or German. When you sign up you get the macro calendar for the quarter straight away: central bank meetings and the major releases in one PDF.
What's inside
One workspace instead of forty tabs.
Macro Terminal
World maps for 900+ indicators, country pages, company pages and your own maps.
Learn more →News, Radar & Impact
The calendar, what builds up over weeks, what an event has moved — and a weekly report.
Learn more →DESK AI
Ask the data in plain words. Every answer opens the right page — and it draws maps for you.
Learn more →Crypto Terminal
Futures positioning, sentiment and the long cycle in one terminal.
Learn more →Portfolio & Journal
Your holdings in the currency you choose, and a journal to review what you did and why.
Learn more →Community & app
Topic channels, direct messages and friends, on the web.
Learn more →Why DESK exists
Built by a trader who was tired of forty tabs.
I have been trading and following the world economy for years. Two things always bothered me. A number gets quoted somewhere — a growth rate, a share of world exports, a death toll — and there is no way to check where it came from. And for everything else you need yet another website, each with its own premium subscription: one for macro data, one for company filings, one for crypto, one for your portfolio, one for your journal.
DESK is the workspace I wanted for myself. Every figure carries its source and year. The world economy, companies and crypto sit in one place, next to weekly reports calculated from real data, DESK AI to ask the data directly, a calm community to talk it through — and, with DESK Pro, a portfolio with its own AI analyst.
It is built for people who are new to markets as much as for anyone who follows macro and politics closely. The words are explained where you meet them, and nothing asks you to take a number on trust.
At the same time, it goes as deep as you want to go: conditions across 900+ indicators, supply chains from the raw material to the company that depends on it, filings in their own words, a DESK Score you can weight yourself, and maps you draw on your own. Start with one country page — or with all of it at once.
And there is no advertising. No sponsored brokers, no paid placements, no affiliate links dressed up as advice, no tracking pixels on our pages. The only thing DESK sells is DESK — a product I can stand behind one hundred percent.
Jonah · founder of DESK
Macro Terminal
See the whole world, then zoom into one country.
- 900+ indicators on interactive world maps, with a time slider back through the years.
- Country pages covering government, economy, geopolitics, military and trade.
- Production, resource and trade-flow maps, plus armed-conflict data.
- Every chart names its source and year.
World at a glance
World Bank · 2024 · example dataWorld at a glance
World Bank · 2024 · example dataWorld GDP growth
World Bank · % per year · example data10 of 64 years · World Bank world and income-group aggregates
World goods trade
World Bank · 2024 · example dataWorld output · commodities
USGS · 2024 · example data| Commodity | Output | since 2020 |
|---|---|---|
| Lithium | 222 kt | +169.1% |
| Copper | 23.0 Mt | +11.7% |
| Cobalt | 302 kt | +112.7% |
| Nickel | 3.7 Mt | +47.8% |
| Gallium | 848 t | +159.3% |
Armed conflict · world
UCDP · 2024 · example dataLargest economies
World Bank · GDP, current US$ · example data| # | Country | GDP | Growth |
|---|---|---|---|
| 1 | United States | $29.3T | +2.8% |
| 2 | China | $18.7T | +5.0% |
| 3 | Germany | $4.7T | -0.5% |
| 4 | Japan | $4.2T | -0.2% |
| 5 | India | $3.8T | +7.1% |
Your own map
Then draw your own.
Every map in DESK is a starting point. The world map is also a sheet you can draw on — and what you draw stays yours.
- Colour by your own rules. Type a condition like
inflation < 3 greenorunemployment > 10 redand the world colours itself. Any of the 900+ indicators works, and several conditions can be combined. - Or colour by hand. Click a country to mark it green, yellow or red, or mix your own colour and give it a name — “supplier”, “sanctioned”, “watchlist”.
- Pins, arrows and paths. Drop a labelled pin anywhere, connect two points with an arrow, draw a route with waypoints. Everything carries a note.
- Several sheets. Name them, reorder them, switch between them. One for energy, one for supply chains, one for a single thesis.
- It stays with your account, not in one browser. Export a map as a file, import it again, or share it with someone in DESK.
Works on the world map and, one level down, inside a single country — states, cities, ports and rivers.
Your own map
example sheet · drag the divider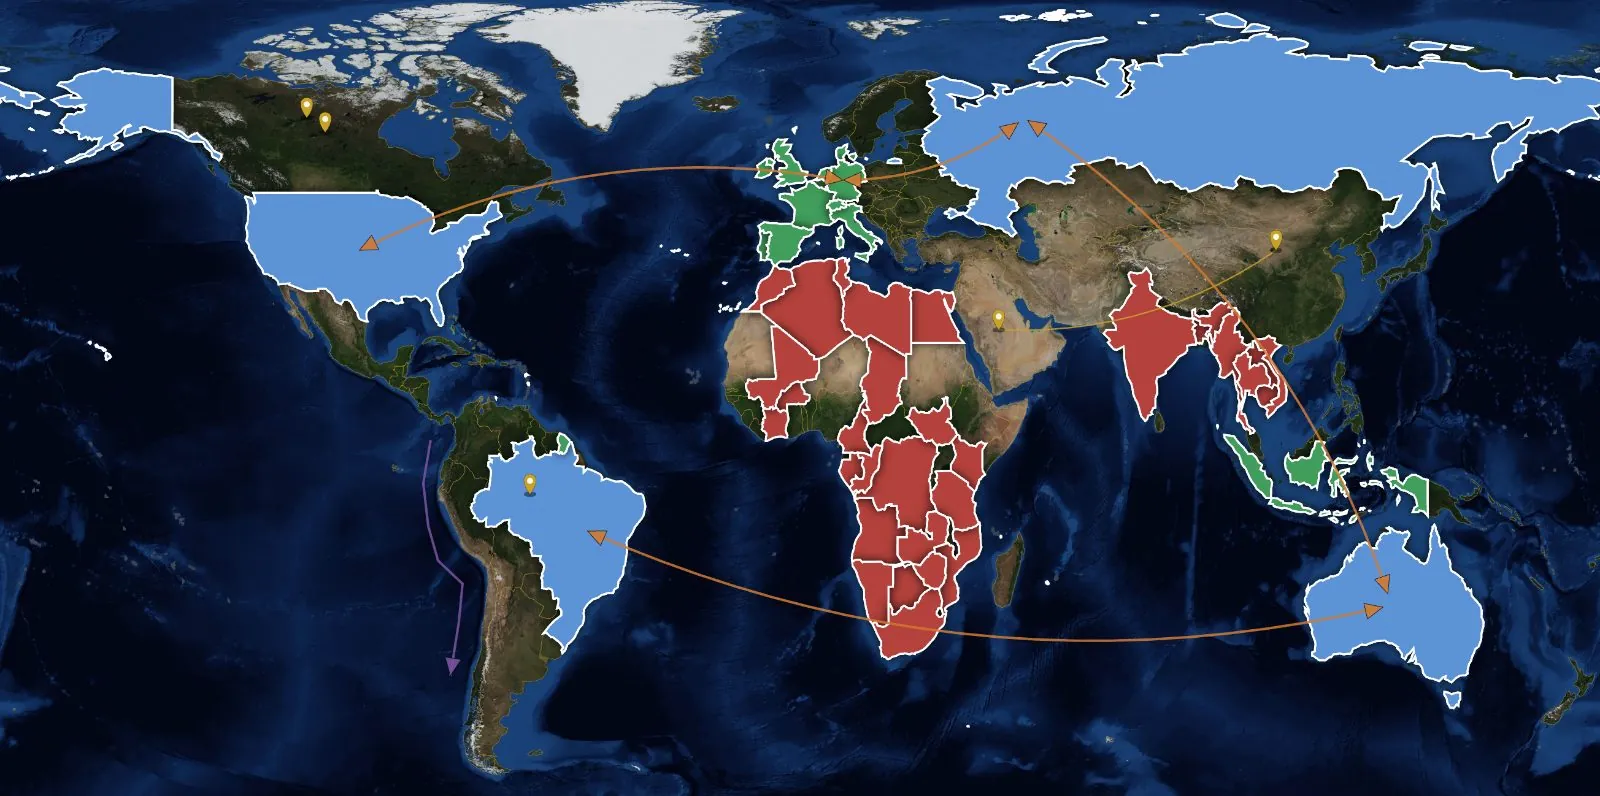
 FlatSatellite
DESK AI
Ask the data. Land on the answer.
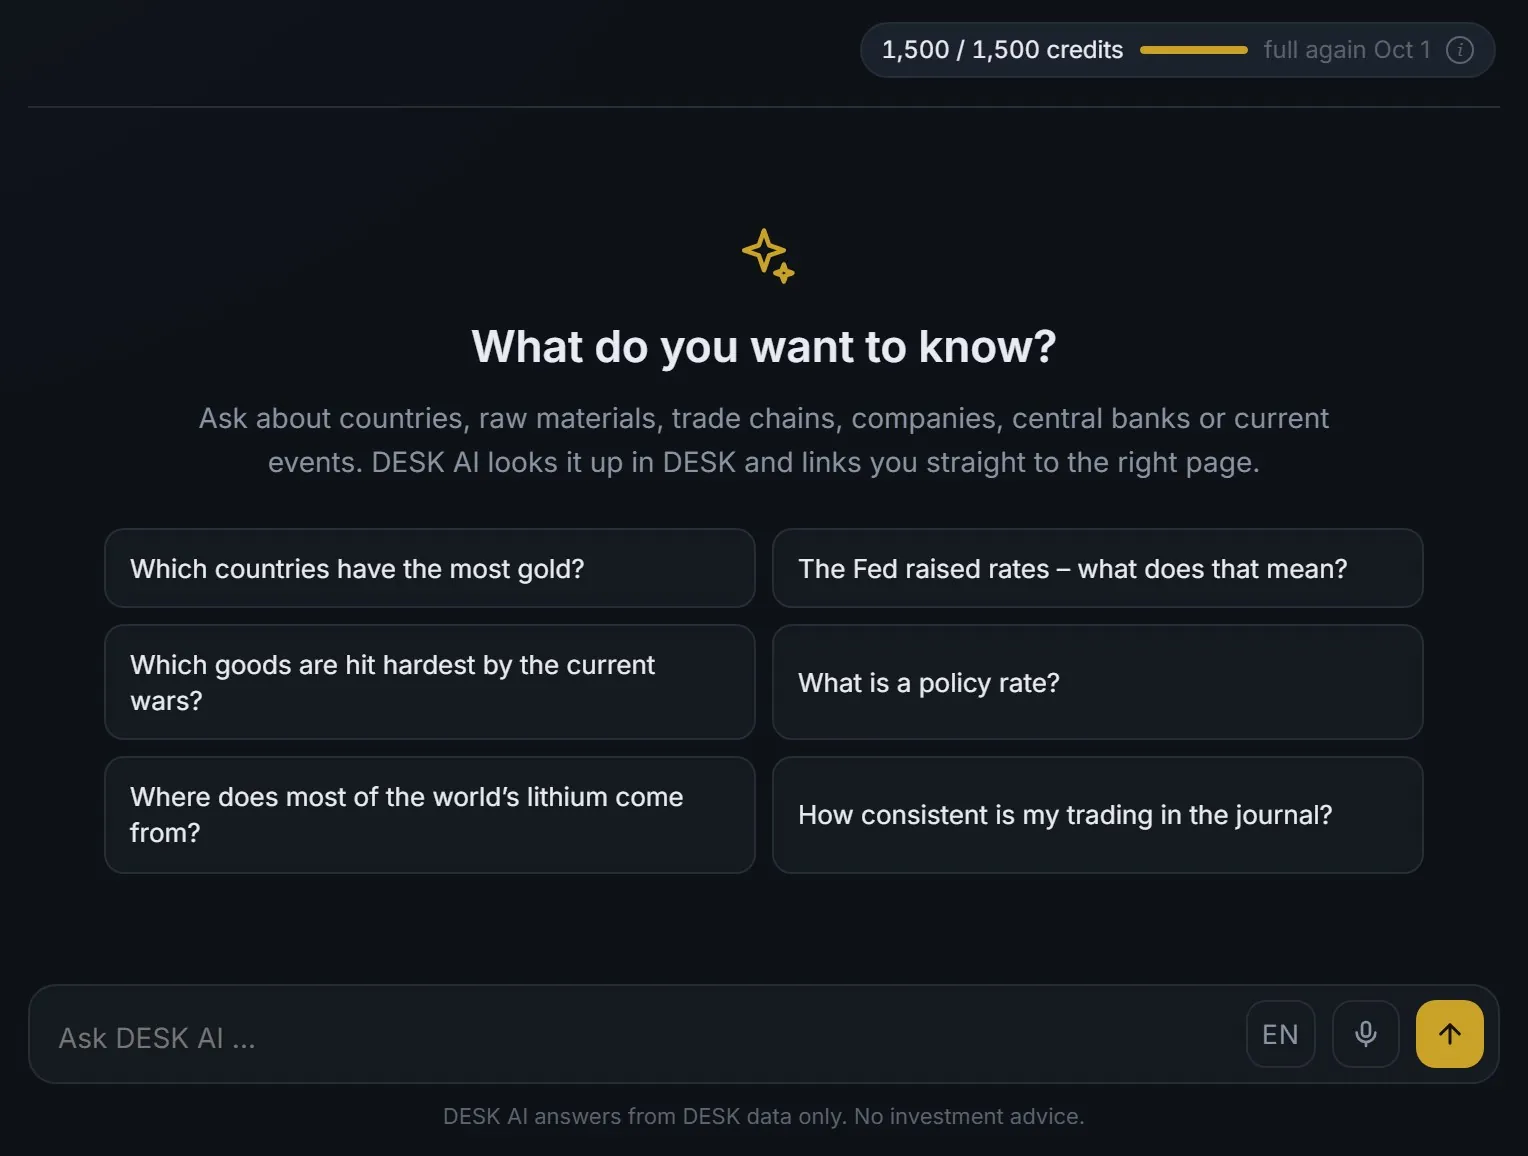
- Ask about countries, raw materials, trade chains, companies, central banks or current events.
- DESK AI looks it up in DESK, not on the open web, and says so when it does not know.
- Every answer comes with buttons that open the right page, already filtered.
- It draws maps for you as well — company headquarters, countries at war, trade connections — ready to add to your own maps.
- 1,500 credits every month; a typical answer uses 10 to 20.
No investment advice.
Company pages
Know the company, not just the ticker.
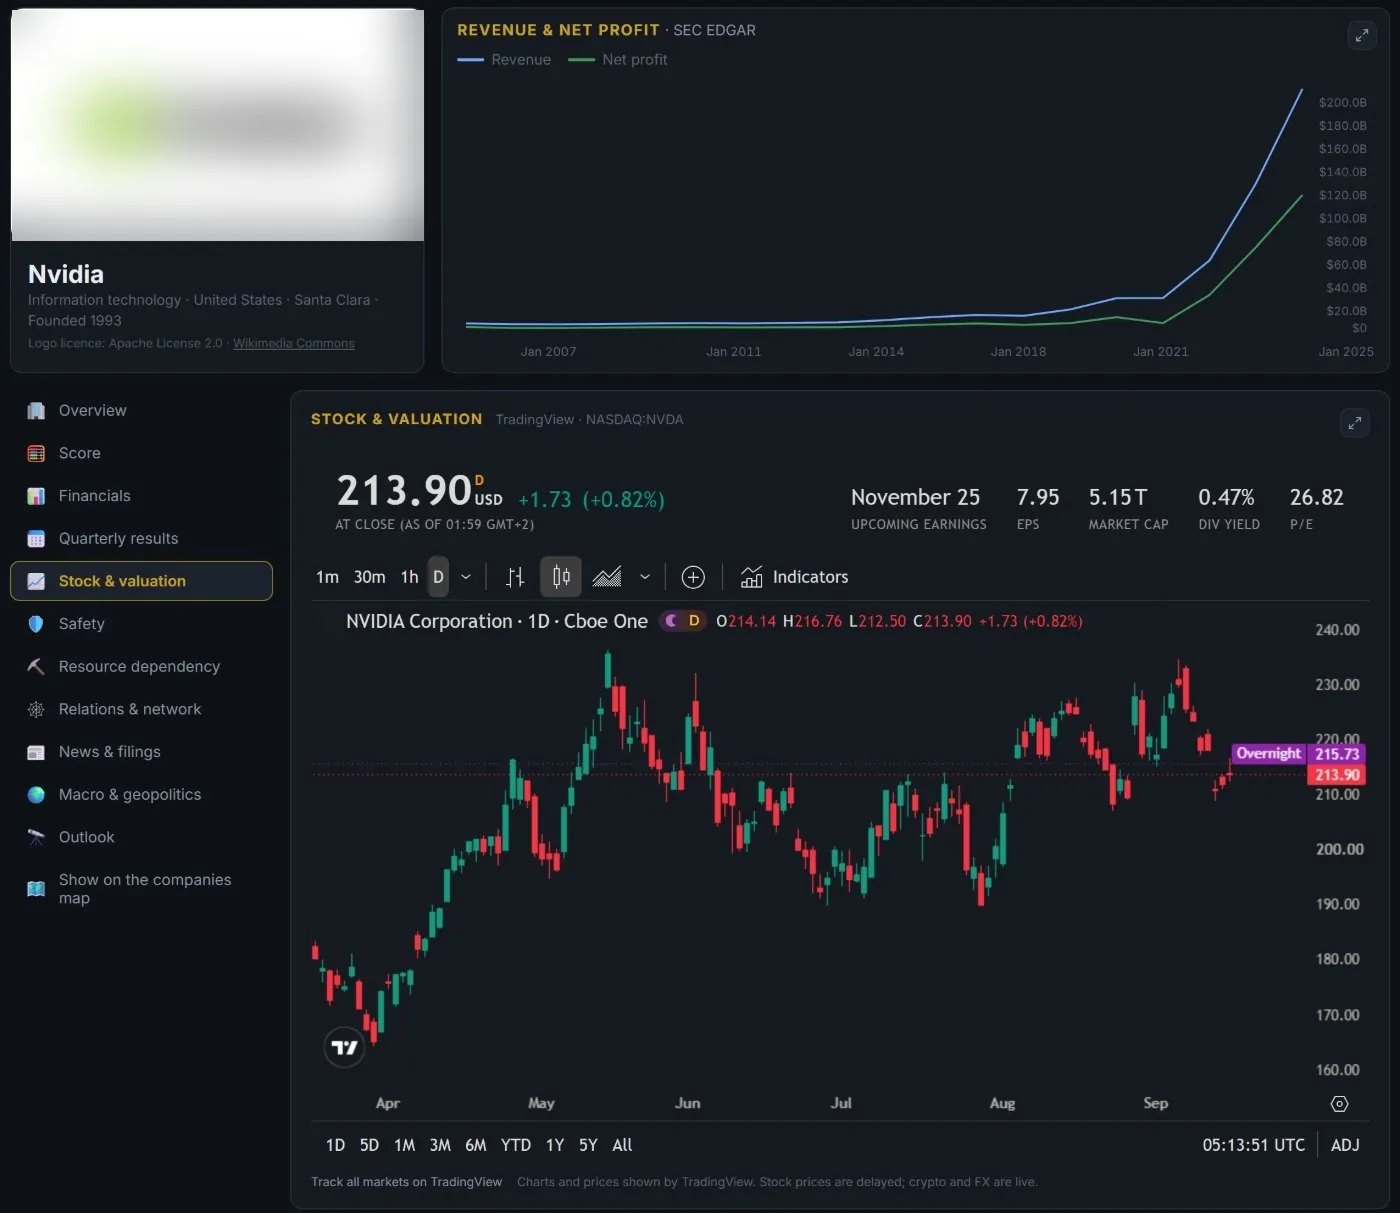
- Revenue, profit and balance sheet over time from official filings.
- A Safety view showing how the business held up in past crises.
- Relations: where its raw materials come from and who it depends on.
- DESK score and an attractiveness matrix to compare peers.
- The live price chart beside the reported figures, shown by TradingView.
Crypto Terminal
Read the cycle.
- Futures positioning on CME and Coinbase, from the CFTC report.
- Dominance and Fear & Greed with their history.
- Rainbow bands, halving countdown and cycle-top indicators.
Cycle & dominance
indexed · example data · click the legend8 of 48 quarters · full cycle view in DESK
Market structure
example dataCycle & dominance
indexed · example data · click the legend8 of 48 quarters · full cycle view in DESK
Market structure
example dataCycle & dominance
indexed · example data · click the legend8 of 48 quarters · full cycle view in DESK
Market structure
example dataCycle & dominance
indexed · example data · click the legend8 of 48 quarters · full cycle view in DESK
Market structure
example dataCycle & dominance
indexed · example data · click the legend8 of 48 quarters · full cycle view in DESK
Market structure
example dataCycle & dominance
indexed · example data · click the legend8 of 48 quarters · full cycle view in DESK
Market structure
example dataCycle & dominance
indexed · example data · click the legend8 of 48 quarters · full cycle view in DESK
Market structure
example dataCycle & dominance
indexed · example data · click the legend8 of 48 quarters · full cycle view in DESK
Market structure
example dataCycle & dominance
indexed · example data · click the legend8 of 48 quarters · full cycle view in DESK
Market structure
example dataNews, Radar & Impact
What is due, what is building up, and what it moved.
- The economic calendar with the high-impact releases of the week.
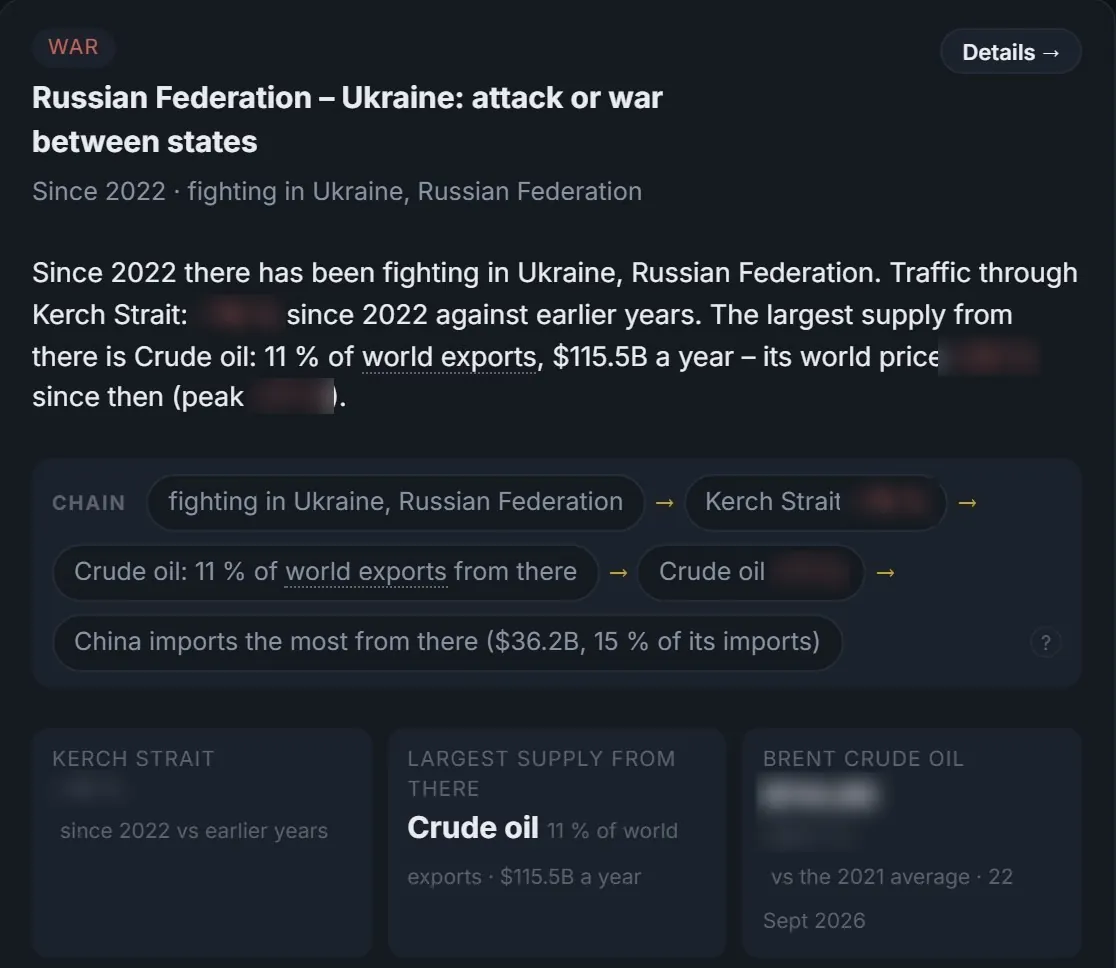
- DESK Radar: what builds up over weeks in news, shipping, conflicts, prices and filings.
- DESK Impact: one card per event, with the chain from cause to effect and the numbers behind it.
- A weekly report every Saturday, in DESK and as a PDF.
Measured, not forecast. No investment advice.
Market Geometry
Structure, not indicators.
- A chart with pitchfork, Fibonacci and box tools, ready to draw on.
- The level sets as a reference, grouped into zones.
- Diagrams and examples next to the terms, linked to the dictionary.
A reference and a workspace. Not a course, not signals, not investment advice.

Your own desk DESKPRO
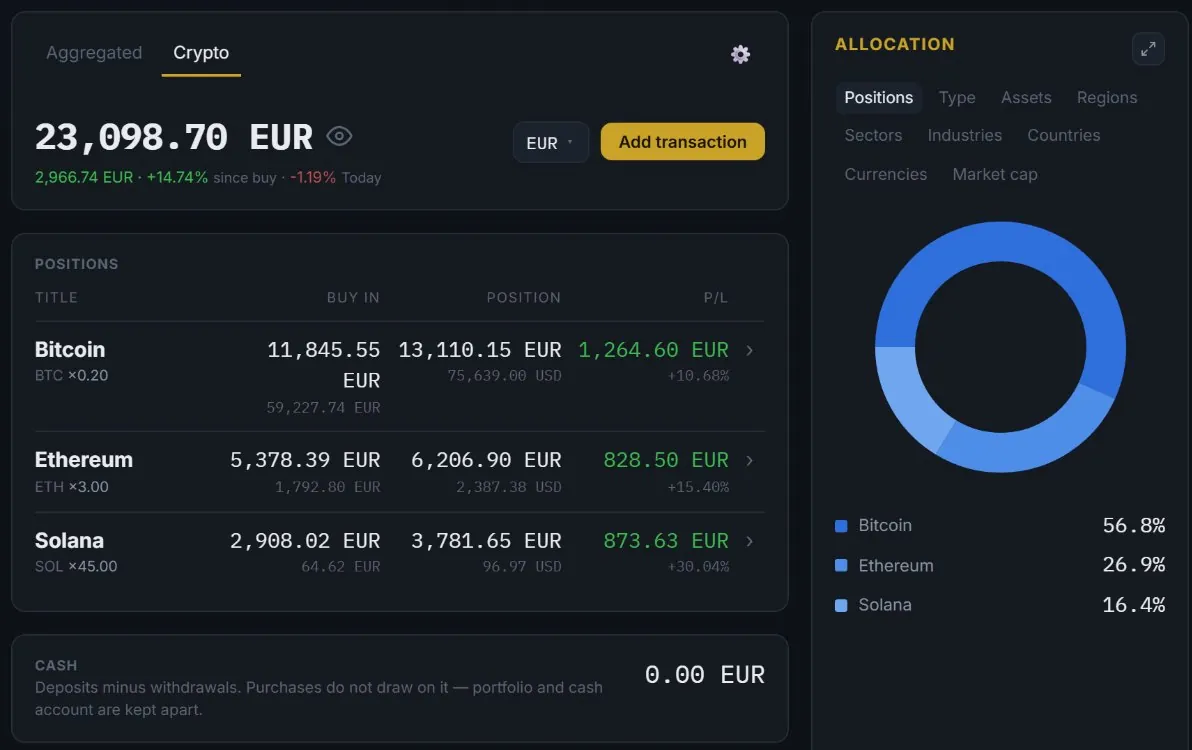
Your portfolio, in the currency you think in.
- Stocks, ETFs and crypto in one portfolio, valued in the currency you choose.
- Allocation by position, sector, region and currency, and how spread out it really is.
- Performance against an index, dividends, goals and a watchlist.
Part of DESK Pro — coming with live market data.
DESK Journal
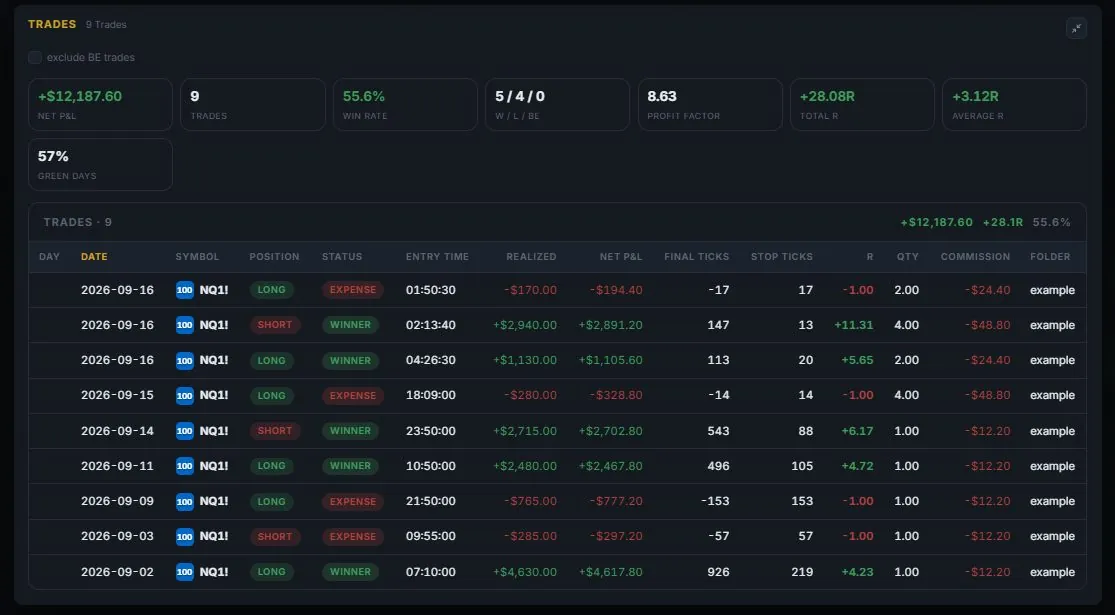
Your trading, written down.
- One entry per trade: instrument, direction, setup, reason, risk, result.
- A closing line for what you would repeat — the part a review actually needs.
- Read back through your own history instead of guessing at it.
- Your entries stay private to your account.
Community
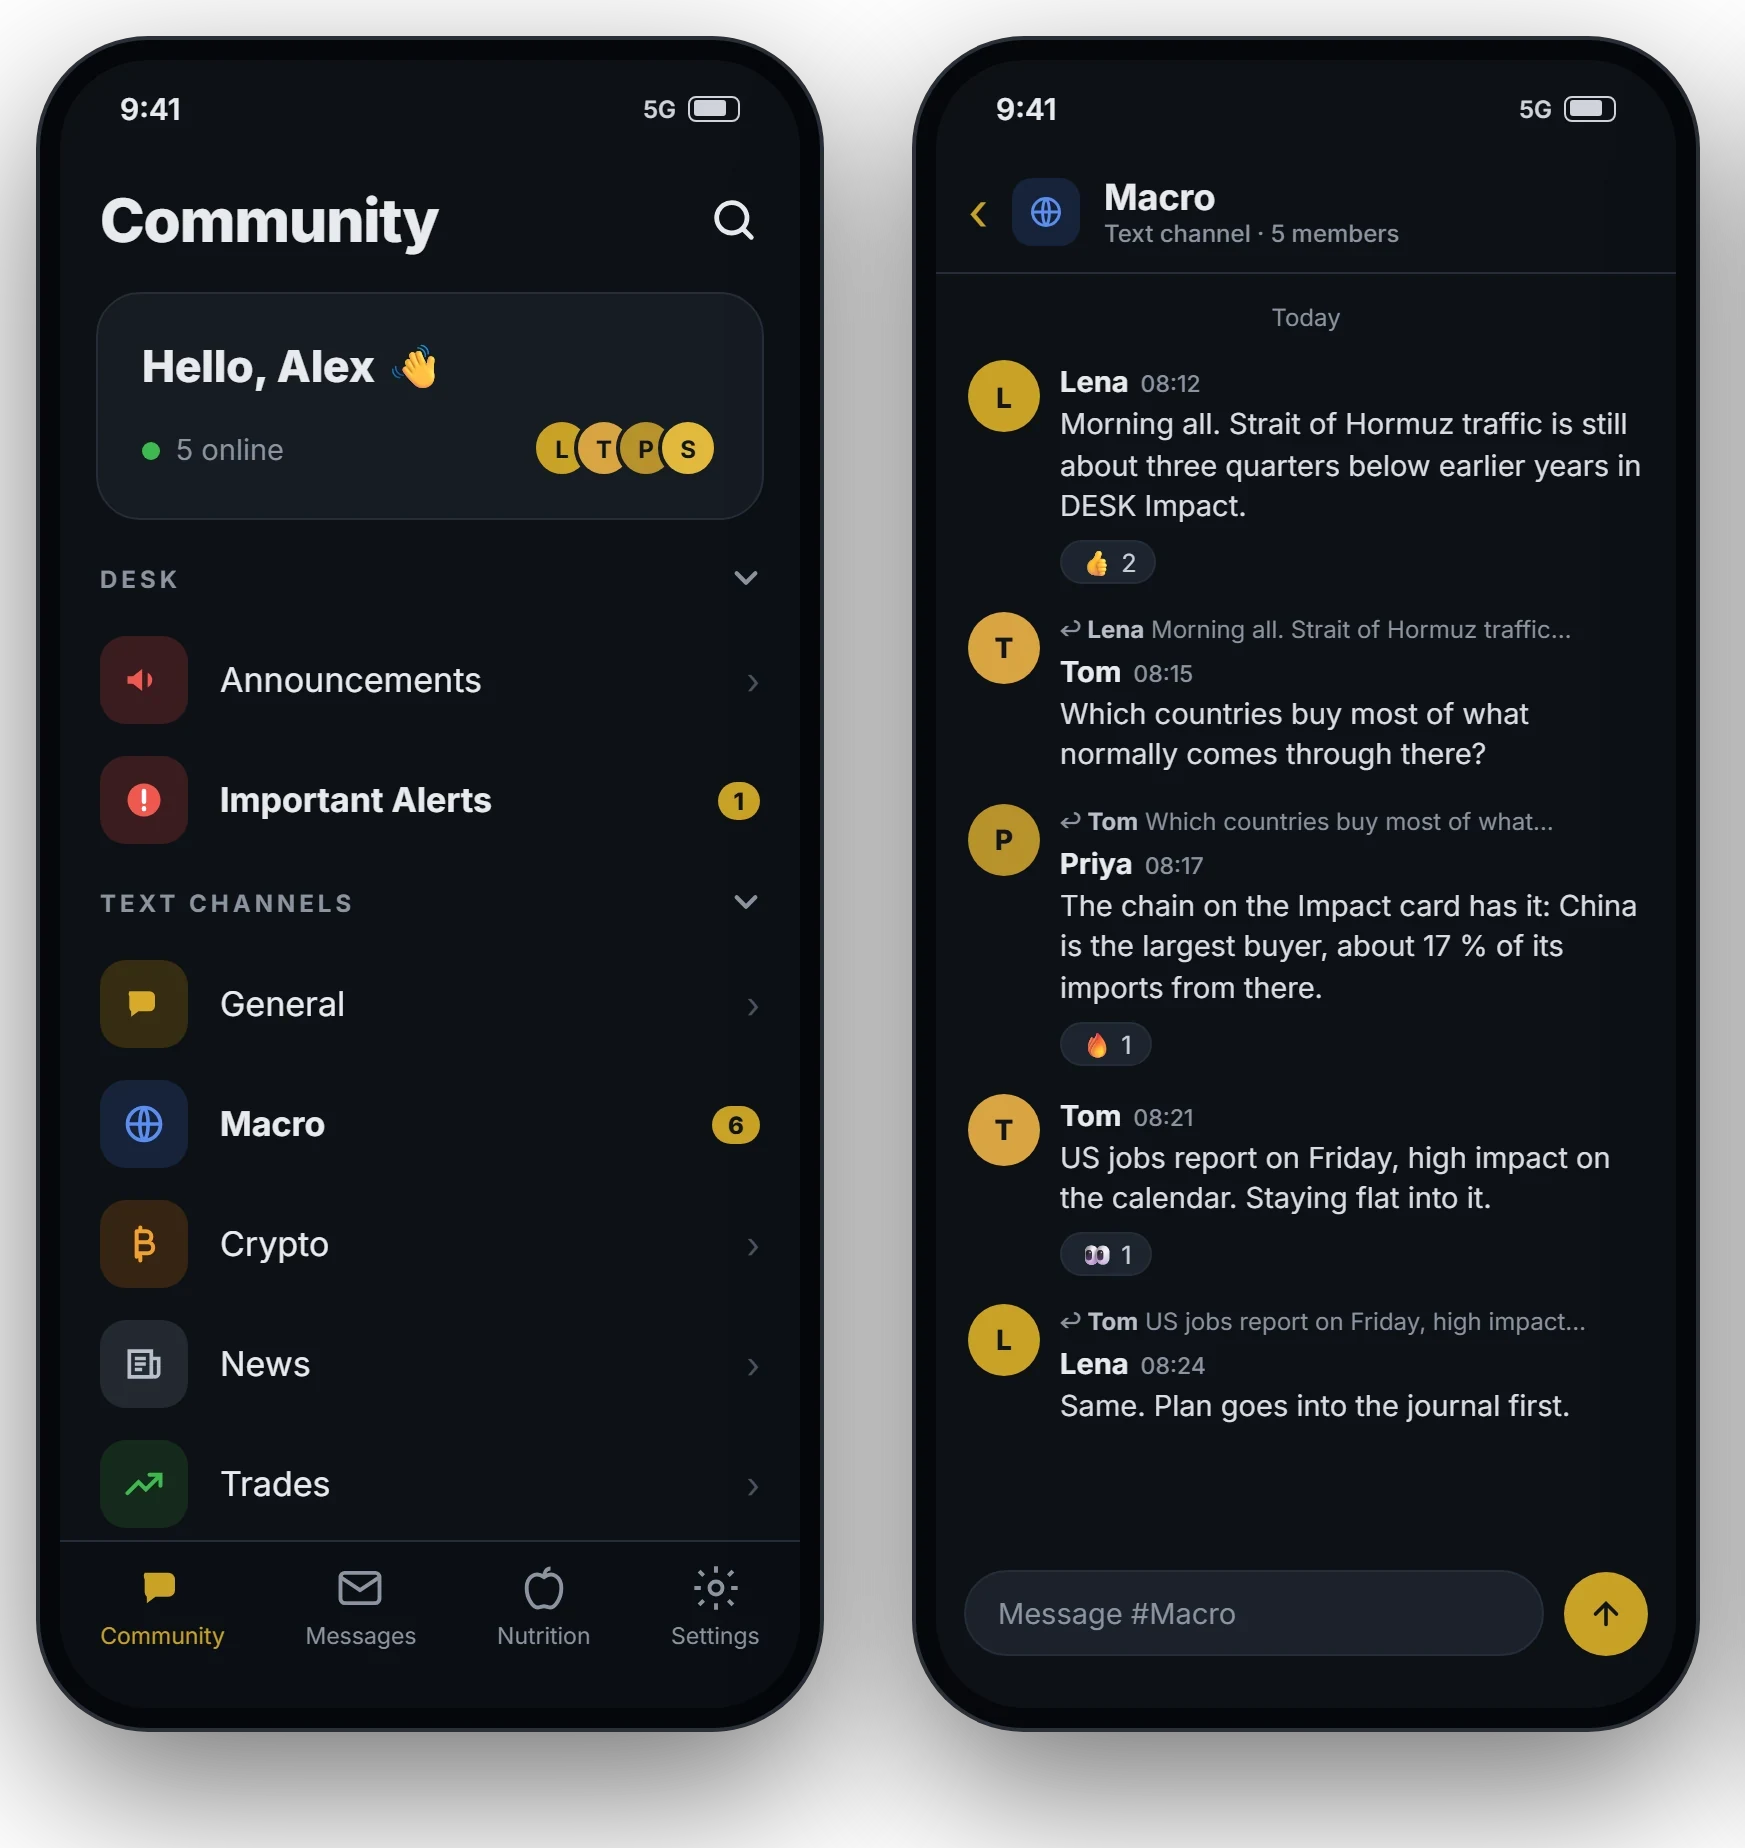
The conversation, right next to the data.
- Topic channels for macro, crypto, news and trades, direct messages and friends.
- Announcements and important alerts from DESK in their own channels.
- Coming soon: DESK Floor for Android and iOS, with the community and your messages.
Plain language
Built for people who are not data scientists.
DESK assumes you want to understand the number, not just see it. Nothing is hidden behind jargon, and nothing asks you to trust us.
Plain-language explanations on every page
Each panel says what the figure means and how to read it.
A dictionary of trading terms
Look up a term where you meet it, without leaving the page.
Sources you can check yourself
Provider, unit and year sit next to every chart and table.
DESK shows data. It does not give investment advice.
Pricing
One plan, €49 a month with the early-access code.
Everything DESK does today for €99 a month, VAT included. During early access the code EARLY49 brings it to €49. DESK Pro follows when live market data arrives.
- Macro Terminal: world maps, country pages, 900+ indicators
- Your own maps: rules, colours, pins and sheets
- Company pages with reported financials
- Crypto Terminal: futures positioning, sentiment and cycles
- News Lite: the high-impact calendar, DESK Radar, DESK Impact and a weekly report
- DESK AI: 1,500 credits every month
- Community: channels, direct messages and friends
- DESK Journal
- Dictionary
- Market Geometry: a chart to test on, and the reference
- Broker, platform and prop firm guide
The whole portfolio: live valuation, performance against an index, dividends, goals and a watchlist. News Pro: every economic release, market headlines and earnings. The full DESK score with market-based ratios.
Announced for the launch of live market data. Current subscribers will be able to upgrade.
FAQ
Questions we get asked.
No. DESK is a research tool. It shows data together with its sources and never tells you what to buy or sell.
From official sources such as the World Bank, SEC filings and UCDP. The Sources page lists all of them, with the provider and year for each figure. Much of it is also published free of charge by the providers themselves, for example the ECB statistics on ecb.europa.eu.
No. Every section explains in plain language what you are looking at, and the dictionary covers the terms you meet along the way.
DESK is being built in the open. New features ship every week, and the changelog shows what's new. DESK costs €99 a month. During early access the code EARLY49 brings it to €49 — and your price stays at €49 for as long as your subscription runs.
Not yet, but soon. DESK Floor, an app for Android and iOS with the community, direct messages and important alerts, is coming soon for members. Until then, use DESK in the browser.
Yes. The subscription is monthly and can be cancelled at any time; it runs until the end of the paid month.
Price charts are live today, shown by TradingView. Live data that DESK can calculate with — for portfolio valuation, dividends and market-based ratios — comes with DESK Pro.
DESK explains the world: the Macro Terminal, company pages, the Crypto Terminal, the high-impact calendar with DESK Radar, DESK Impact and the weekly report, DESK AI, the community, the journal and the dictionary. DESK Pro adds the portfolio, all economic releases, market headlines and earnings.