What is in it
- A full chart with drawing tools: pitchfork, Fibonacci retracement, box and trend line, on any symbol TradingView shows.
- The retracement zones as a reference card, grouped the way they are used at the desk.
- The pitchfork after Alan Andrews: median line and the two parallels.
- Diagrams and annotated examples next to the terms, each linked to the dictionary.
- Session alerts, so the open of a market does not slip by.
A reference and a workspace — not a course, not signals, not investment advice.
Draw on the chart
The tools are on the left, the symbol at the top — open it and start.
Look it up
The zones and terms are one click away, not in a separate document.
Publicly documented
Pitchforks, Fibonacci ratios and pivots are decades old; the dictionary explains them.
Inside DESK
What it looks like.
Example drawings for explanation. They are not trade ideas.
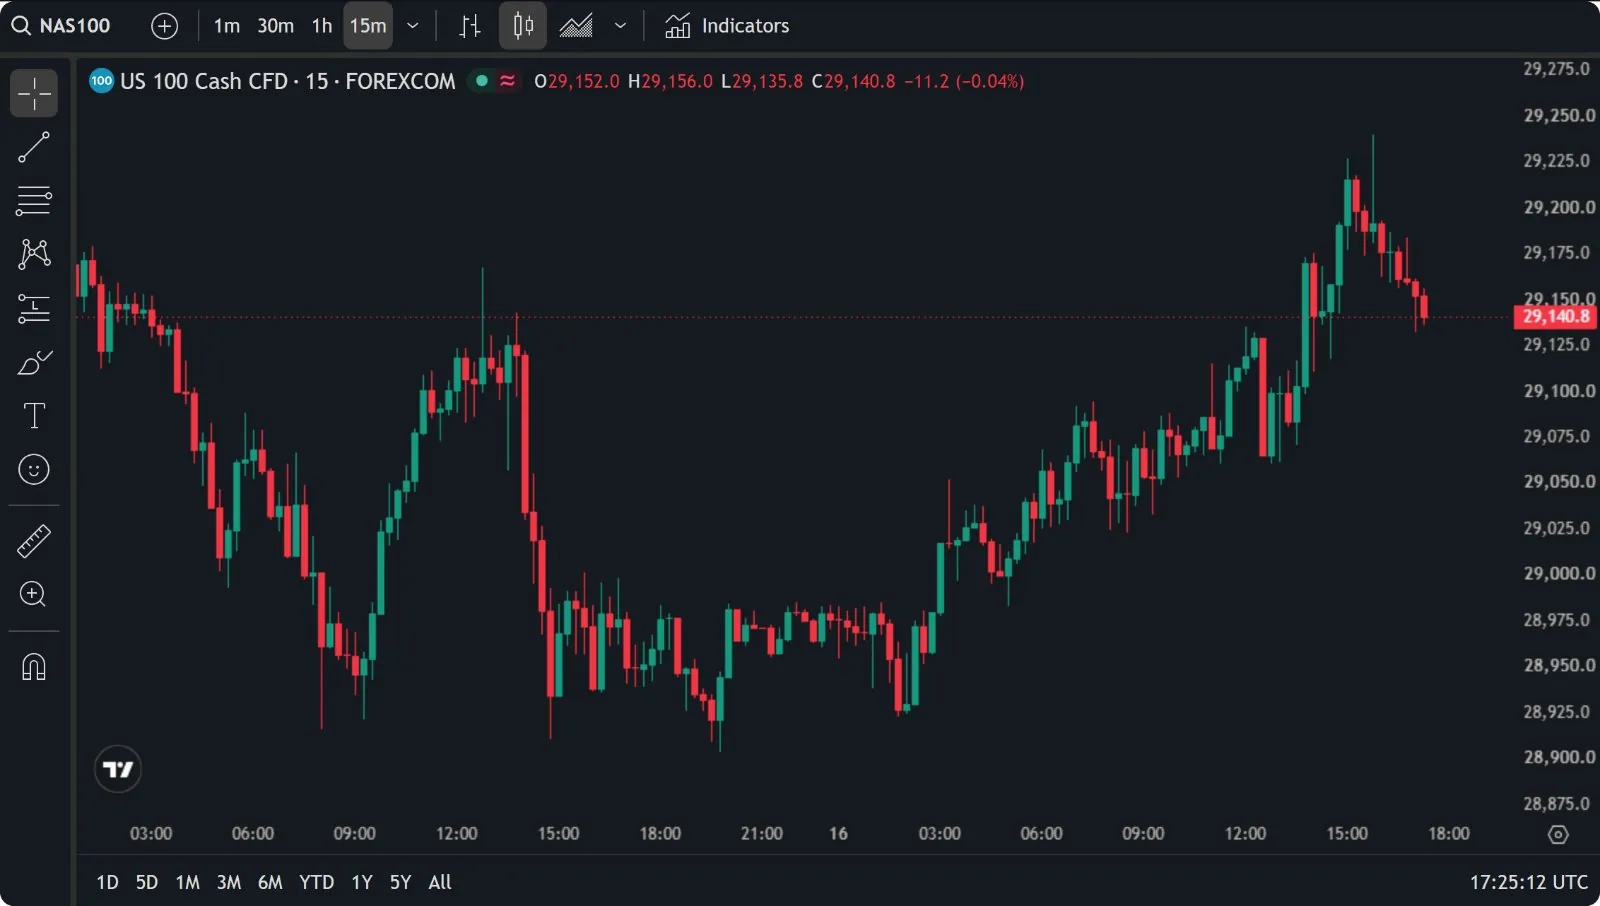
A chart to test on
The full TradingView chart inside DESK, with the drawing tools on the left and the symbol search at the top.
- Draw pitchforks, retracements, boxes and trend lines, and see how price reacted.
- Any interval from one minute to one month.
- Open any market you follow.

Zones, not single lines
A swing, and the areas where price tends to pause on the way back — drawn as zones rather than as one exact number.
- A shallow, a classic and a deep pullback, and the extensions beyond the swing.
- The exact zones and how they are used are inside DESK.

The pitchfork
Three pivots, A, B and C. The median line runs from A through the middle of B and C, the parallels through B and C.
- The median line is where price is drawn back to.
- The parallels frame the move on either side.
- Drawn in DESK with the pitchfork tool of the chart.
Built on
named on every panel in the appTradingView widgets · your own drawings · no data provider